Overview
In this guide, you will learn:
- How to access and use Keka PSA Analytics
- What key insights are available across financials, project metrics, and resources
- How to customize your analysis for business impact
- Which filters and dimensions can be applied for deep reporting
Who Can Do This?
- Project Managers
- Finance Teams
- Resource Planners
- PSA Admins with Analytics module access
Pre-requisites
- Access to the Analytics module under the Projects tab
- Revenue Intelligence Charts are available only for tenants on the Advanced Plan
Step-by-Step Instructions
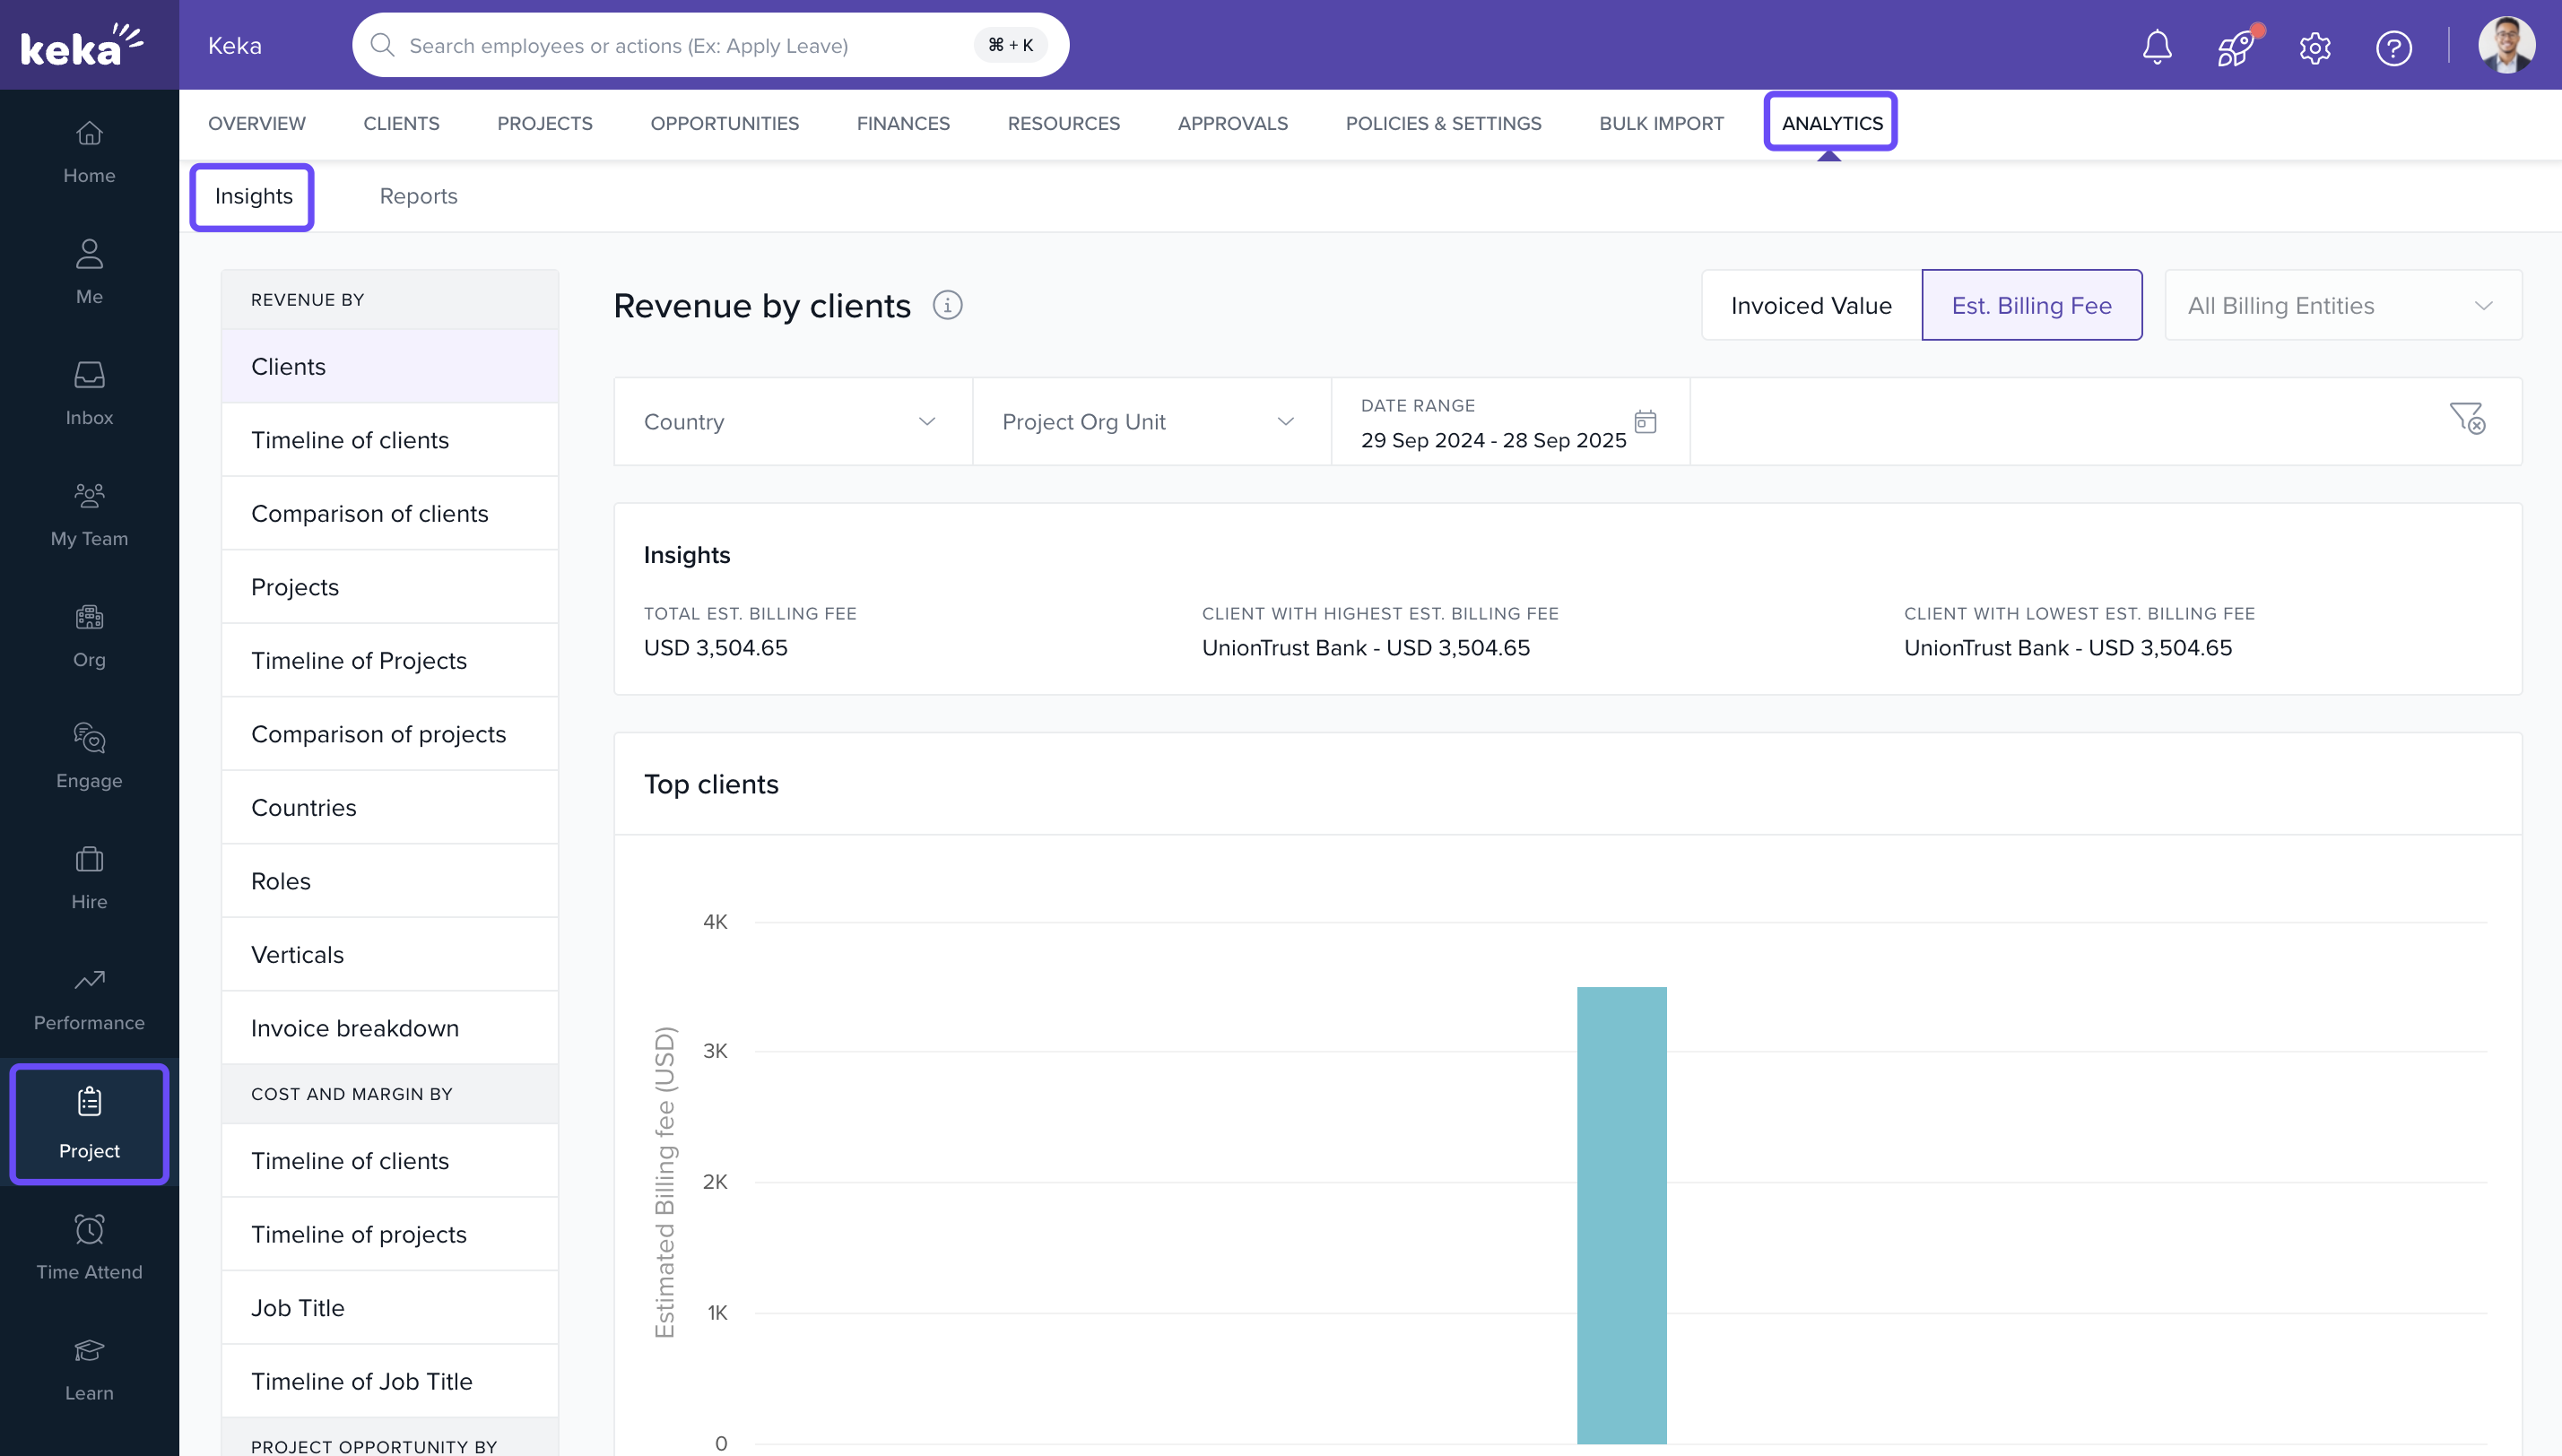
Access Keka PSA Analytics
- Go to the Projects section.
- Click on the Analytics tab.
- Select Insights from the menu.
- You will find multiple categories: Revenue Analysis, Cost and Margin Analysis, Resource Insights, Project Opportunity Analysis.
Perform Data Analysis
- Choose the relevant analysis type.
- Apply filters such as Country, Date Range, Client, Project, Role, or Vertical.
- View insights in interactive charts and tables.
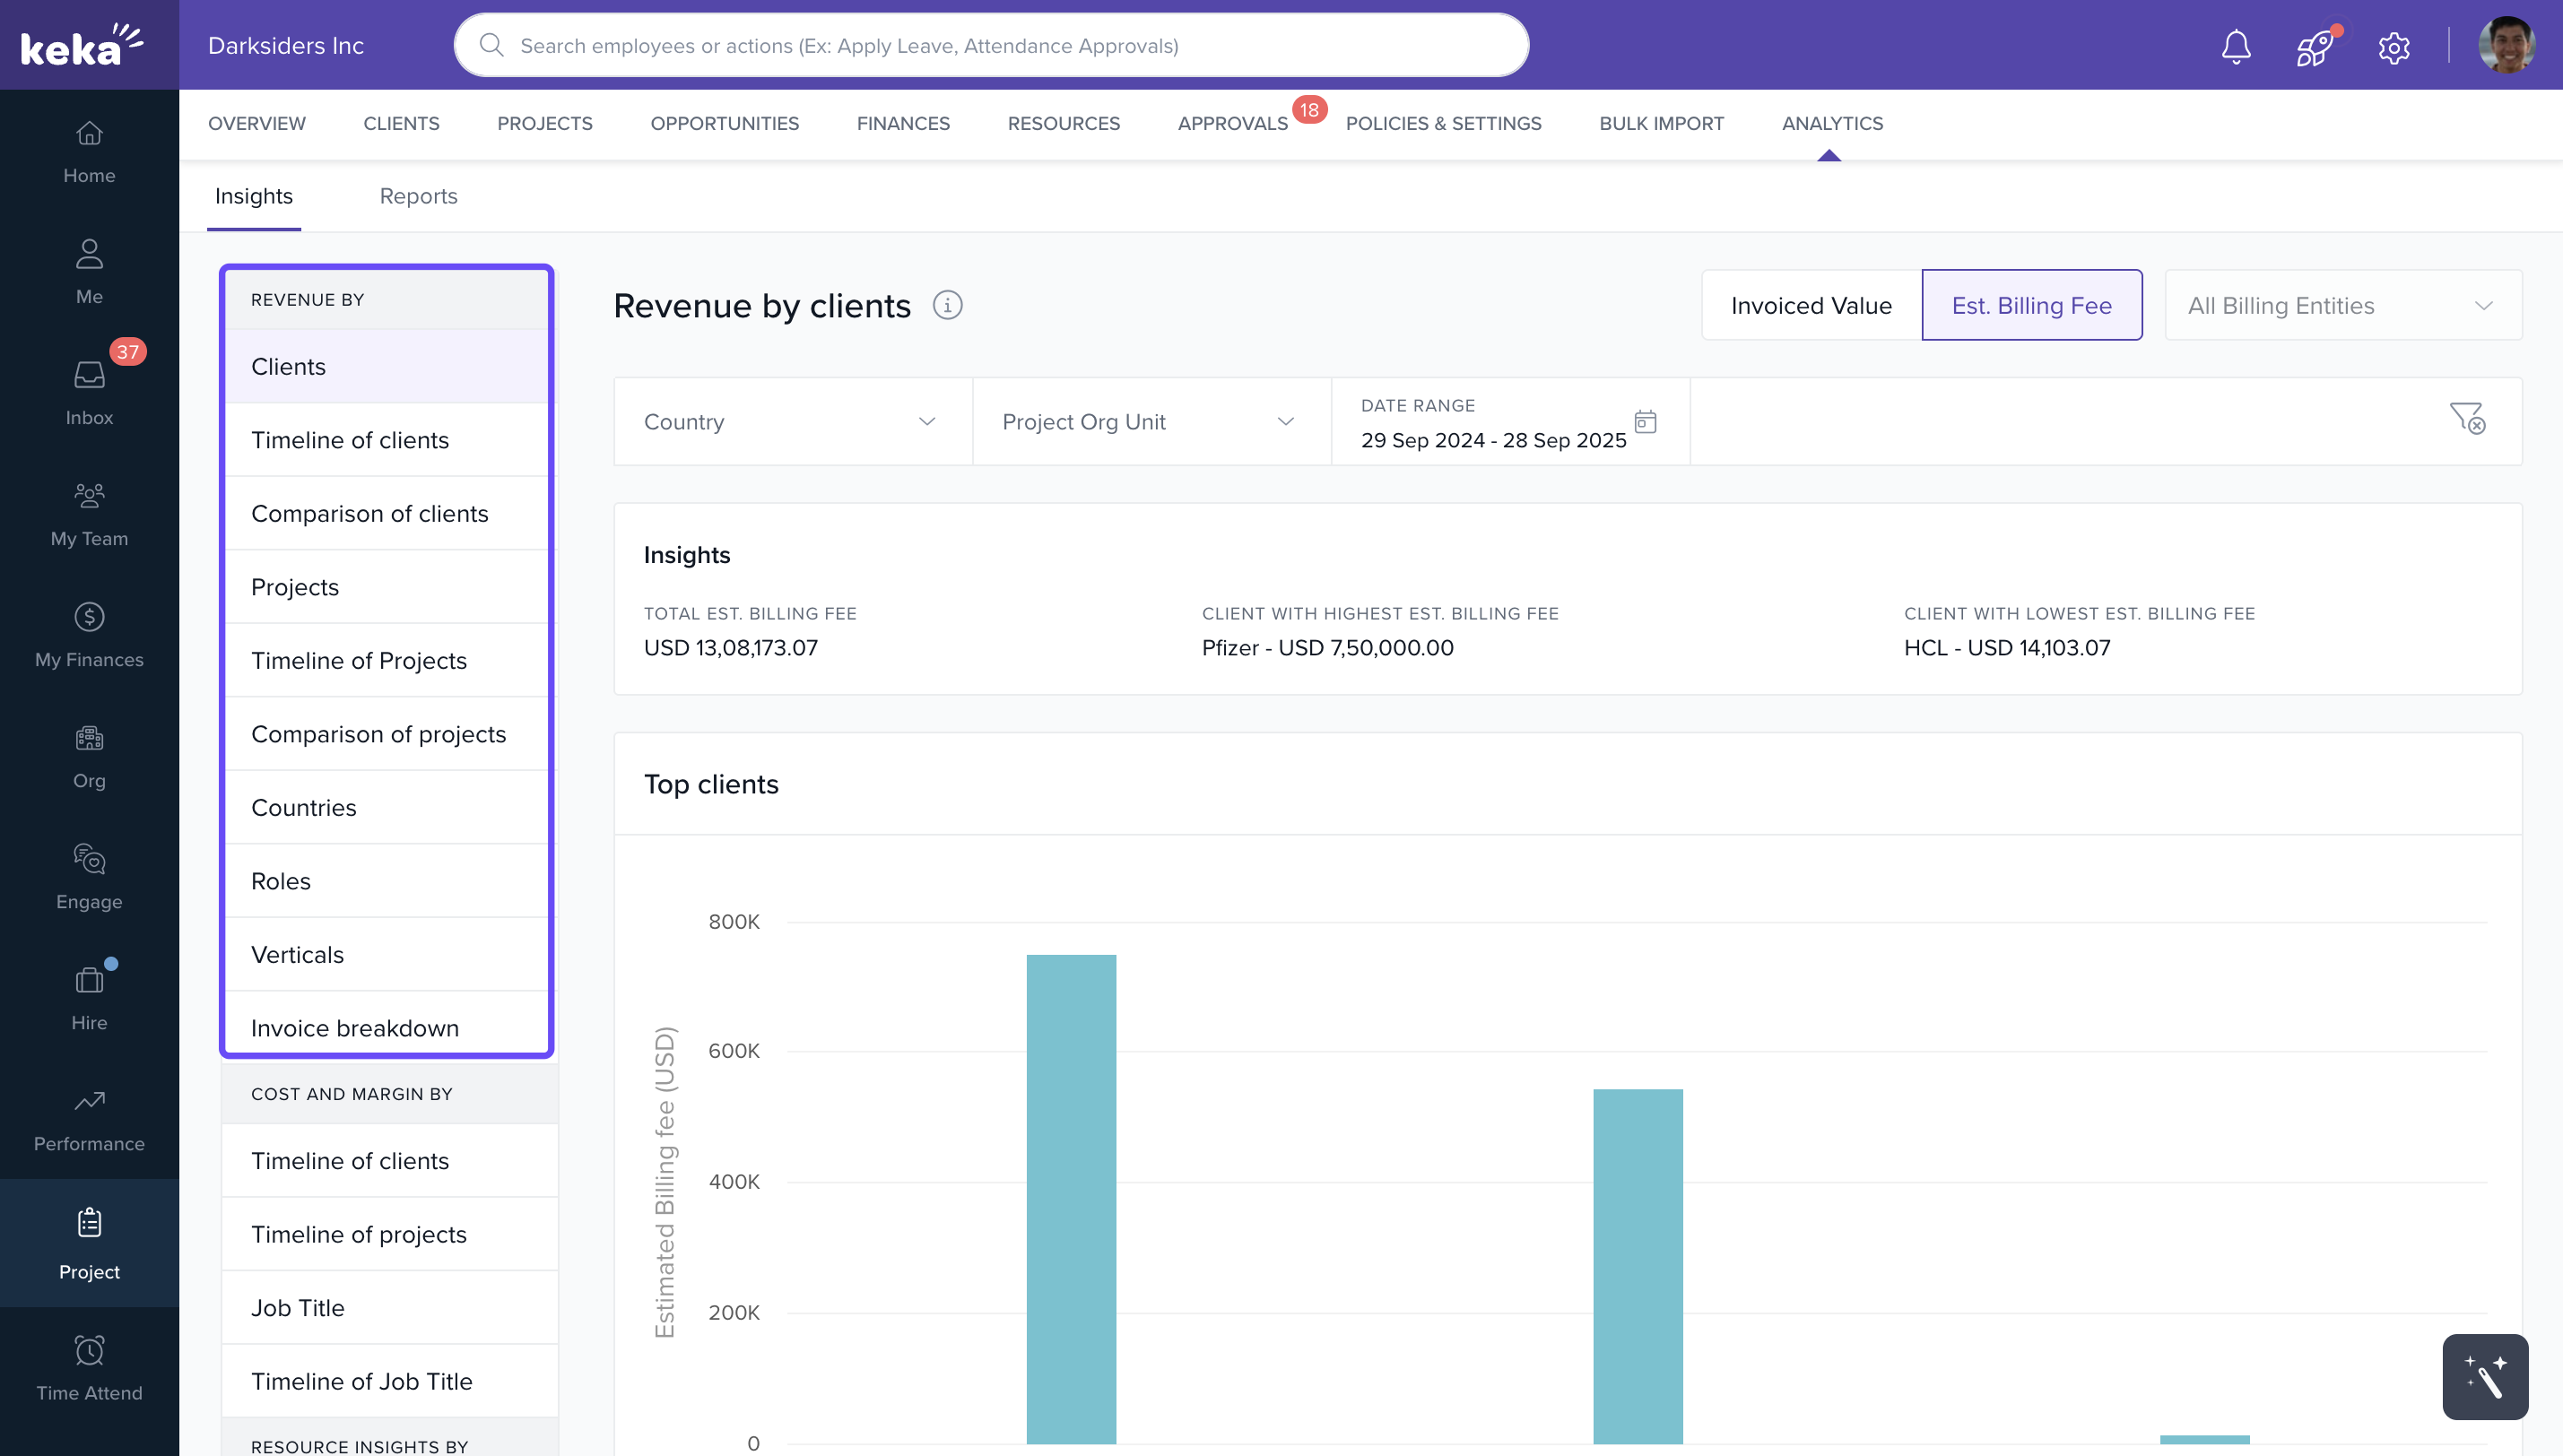
Customize Your Analysis
-
Revenue Insights: View revenue breakdowns by invoice value, estimated billing, client, project, or geography.
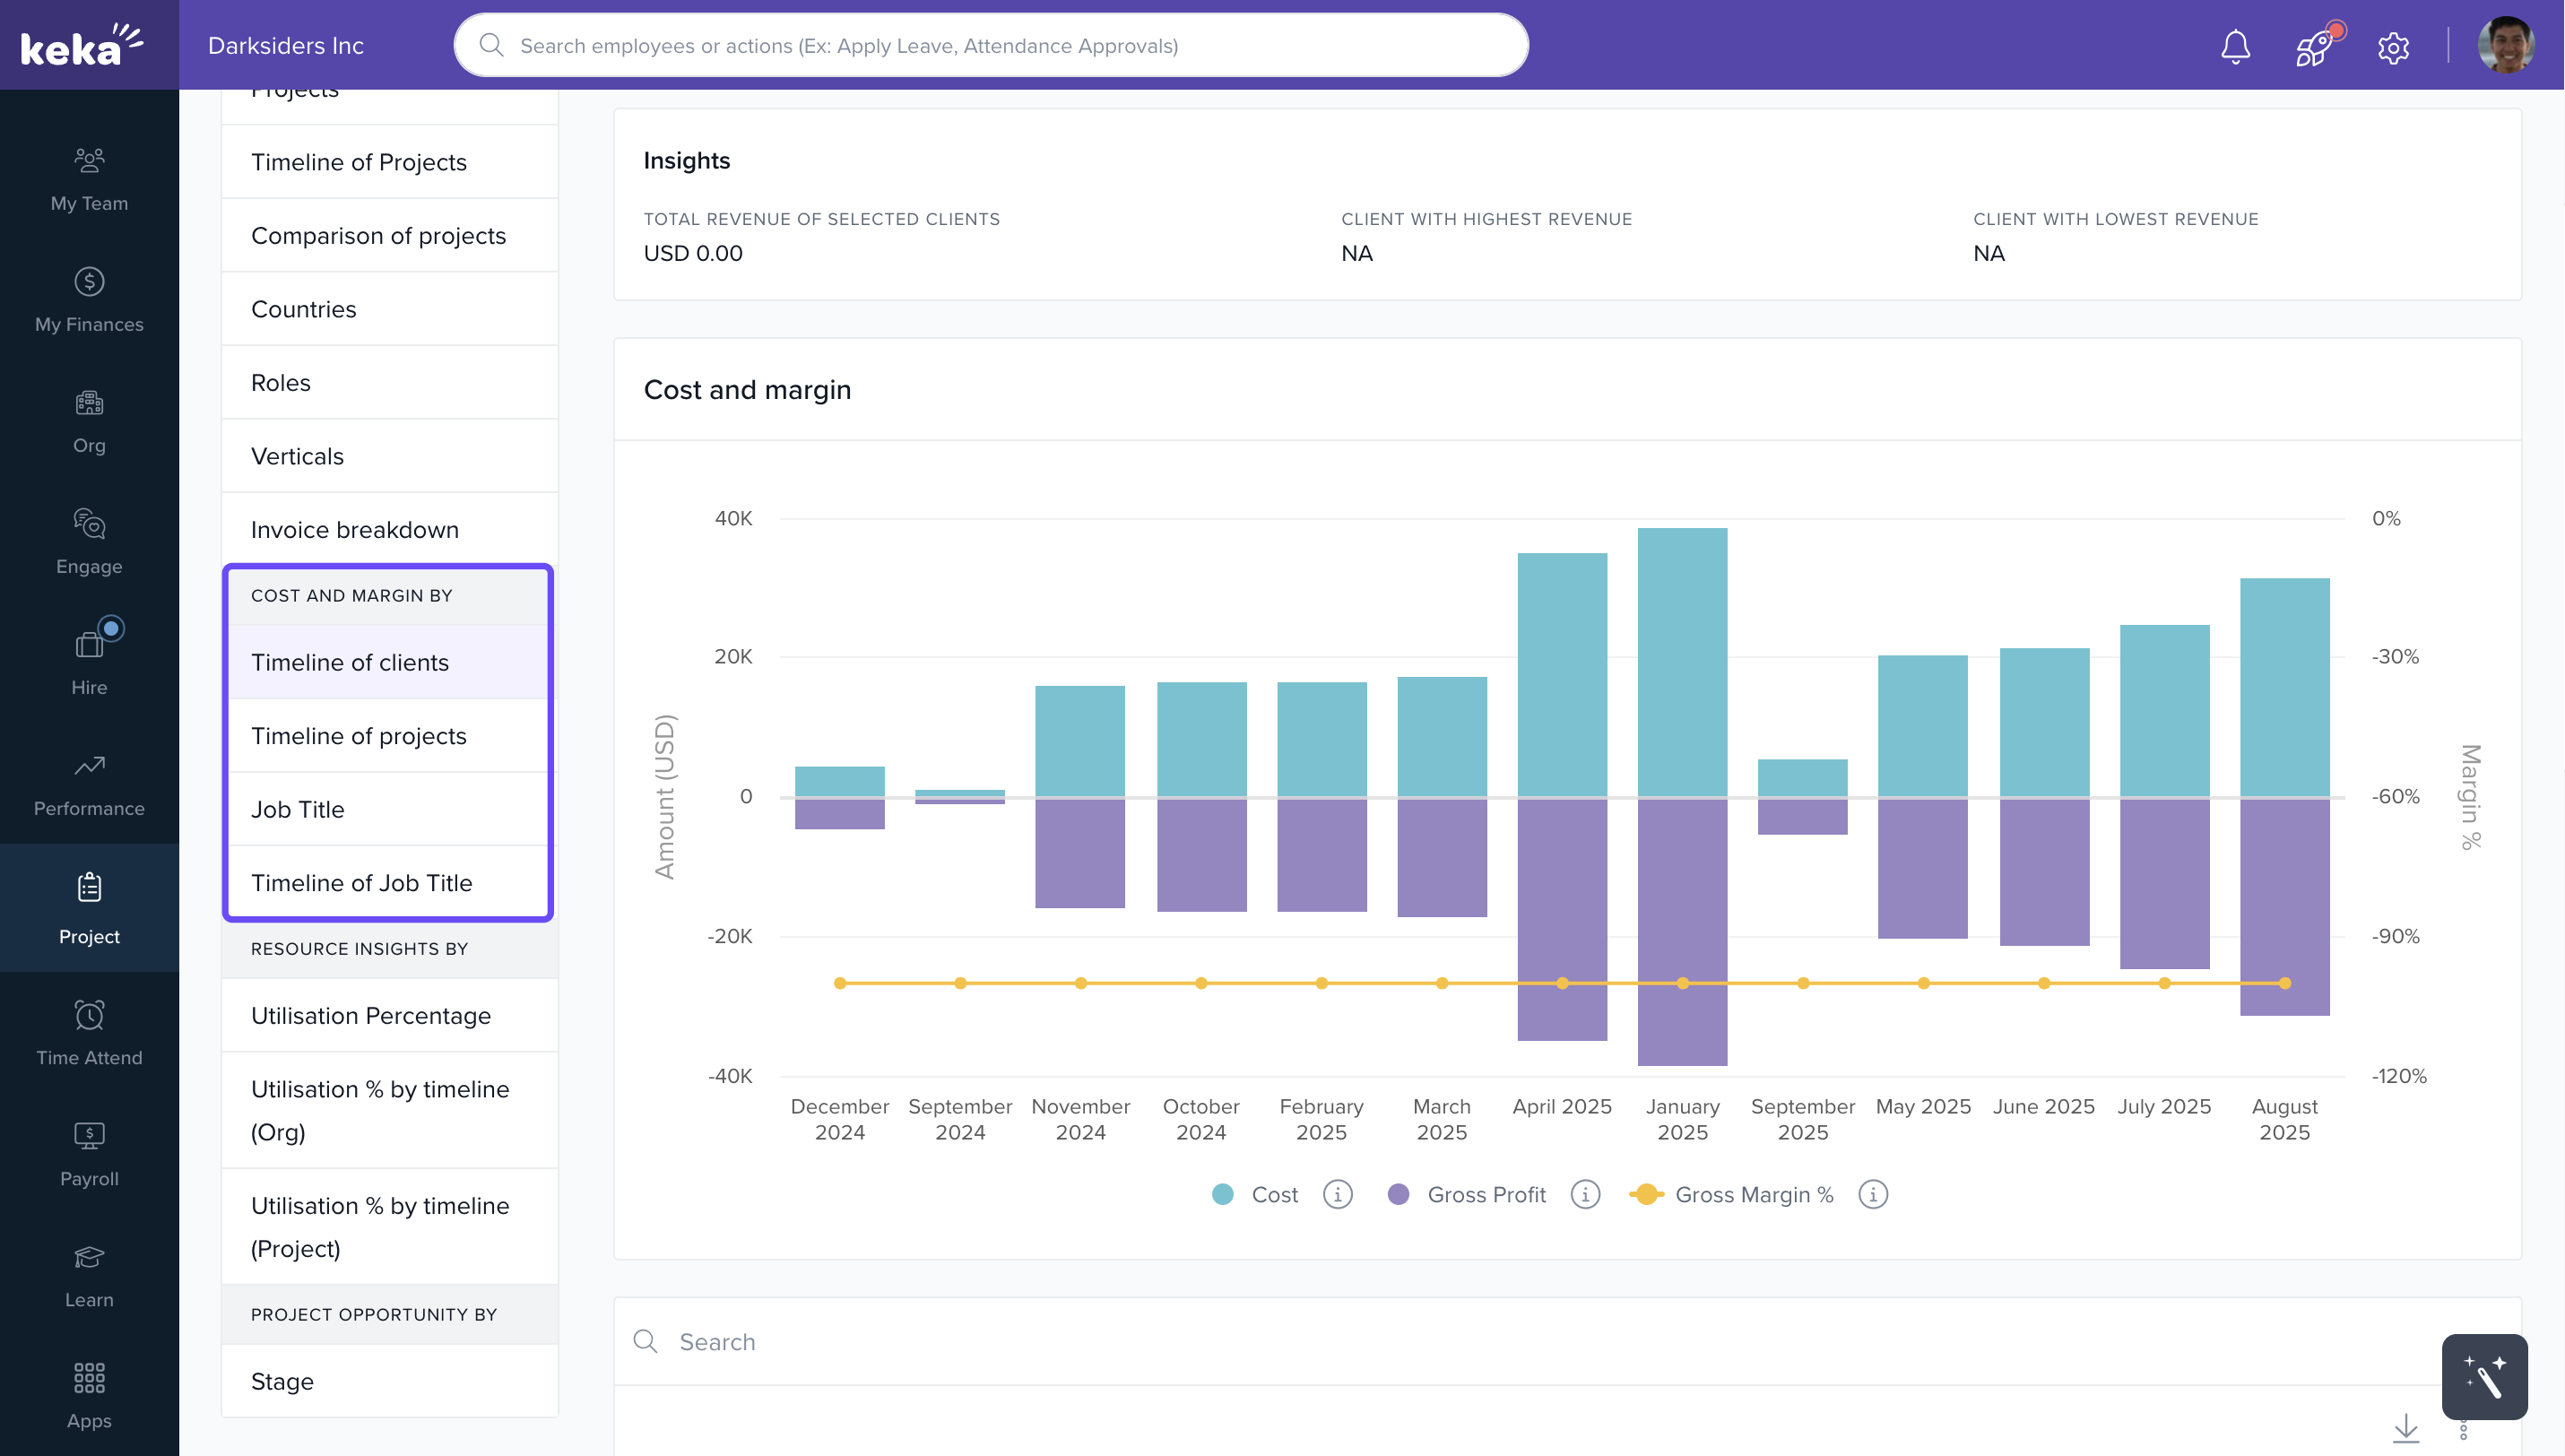
-
Cost and Margin Insights: Filter by role, project, and time period to evaluate profitability.
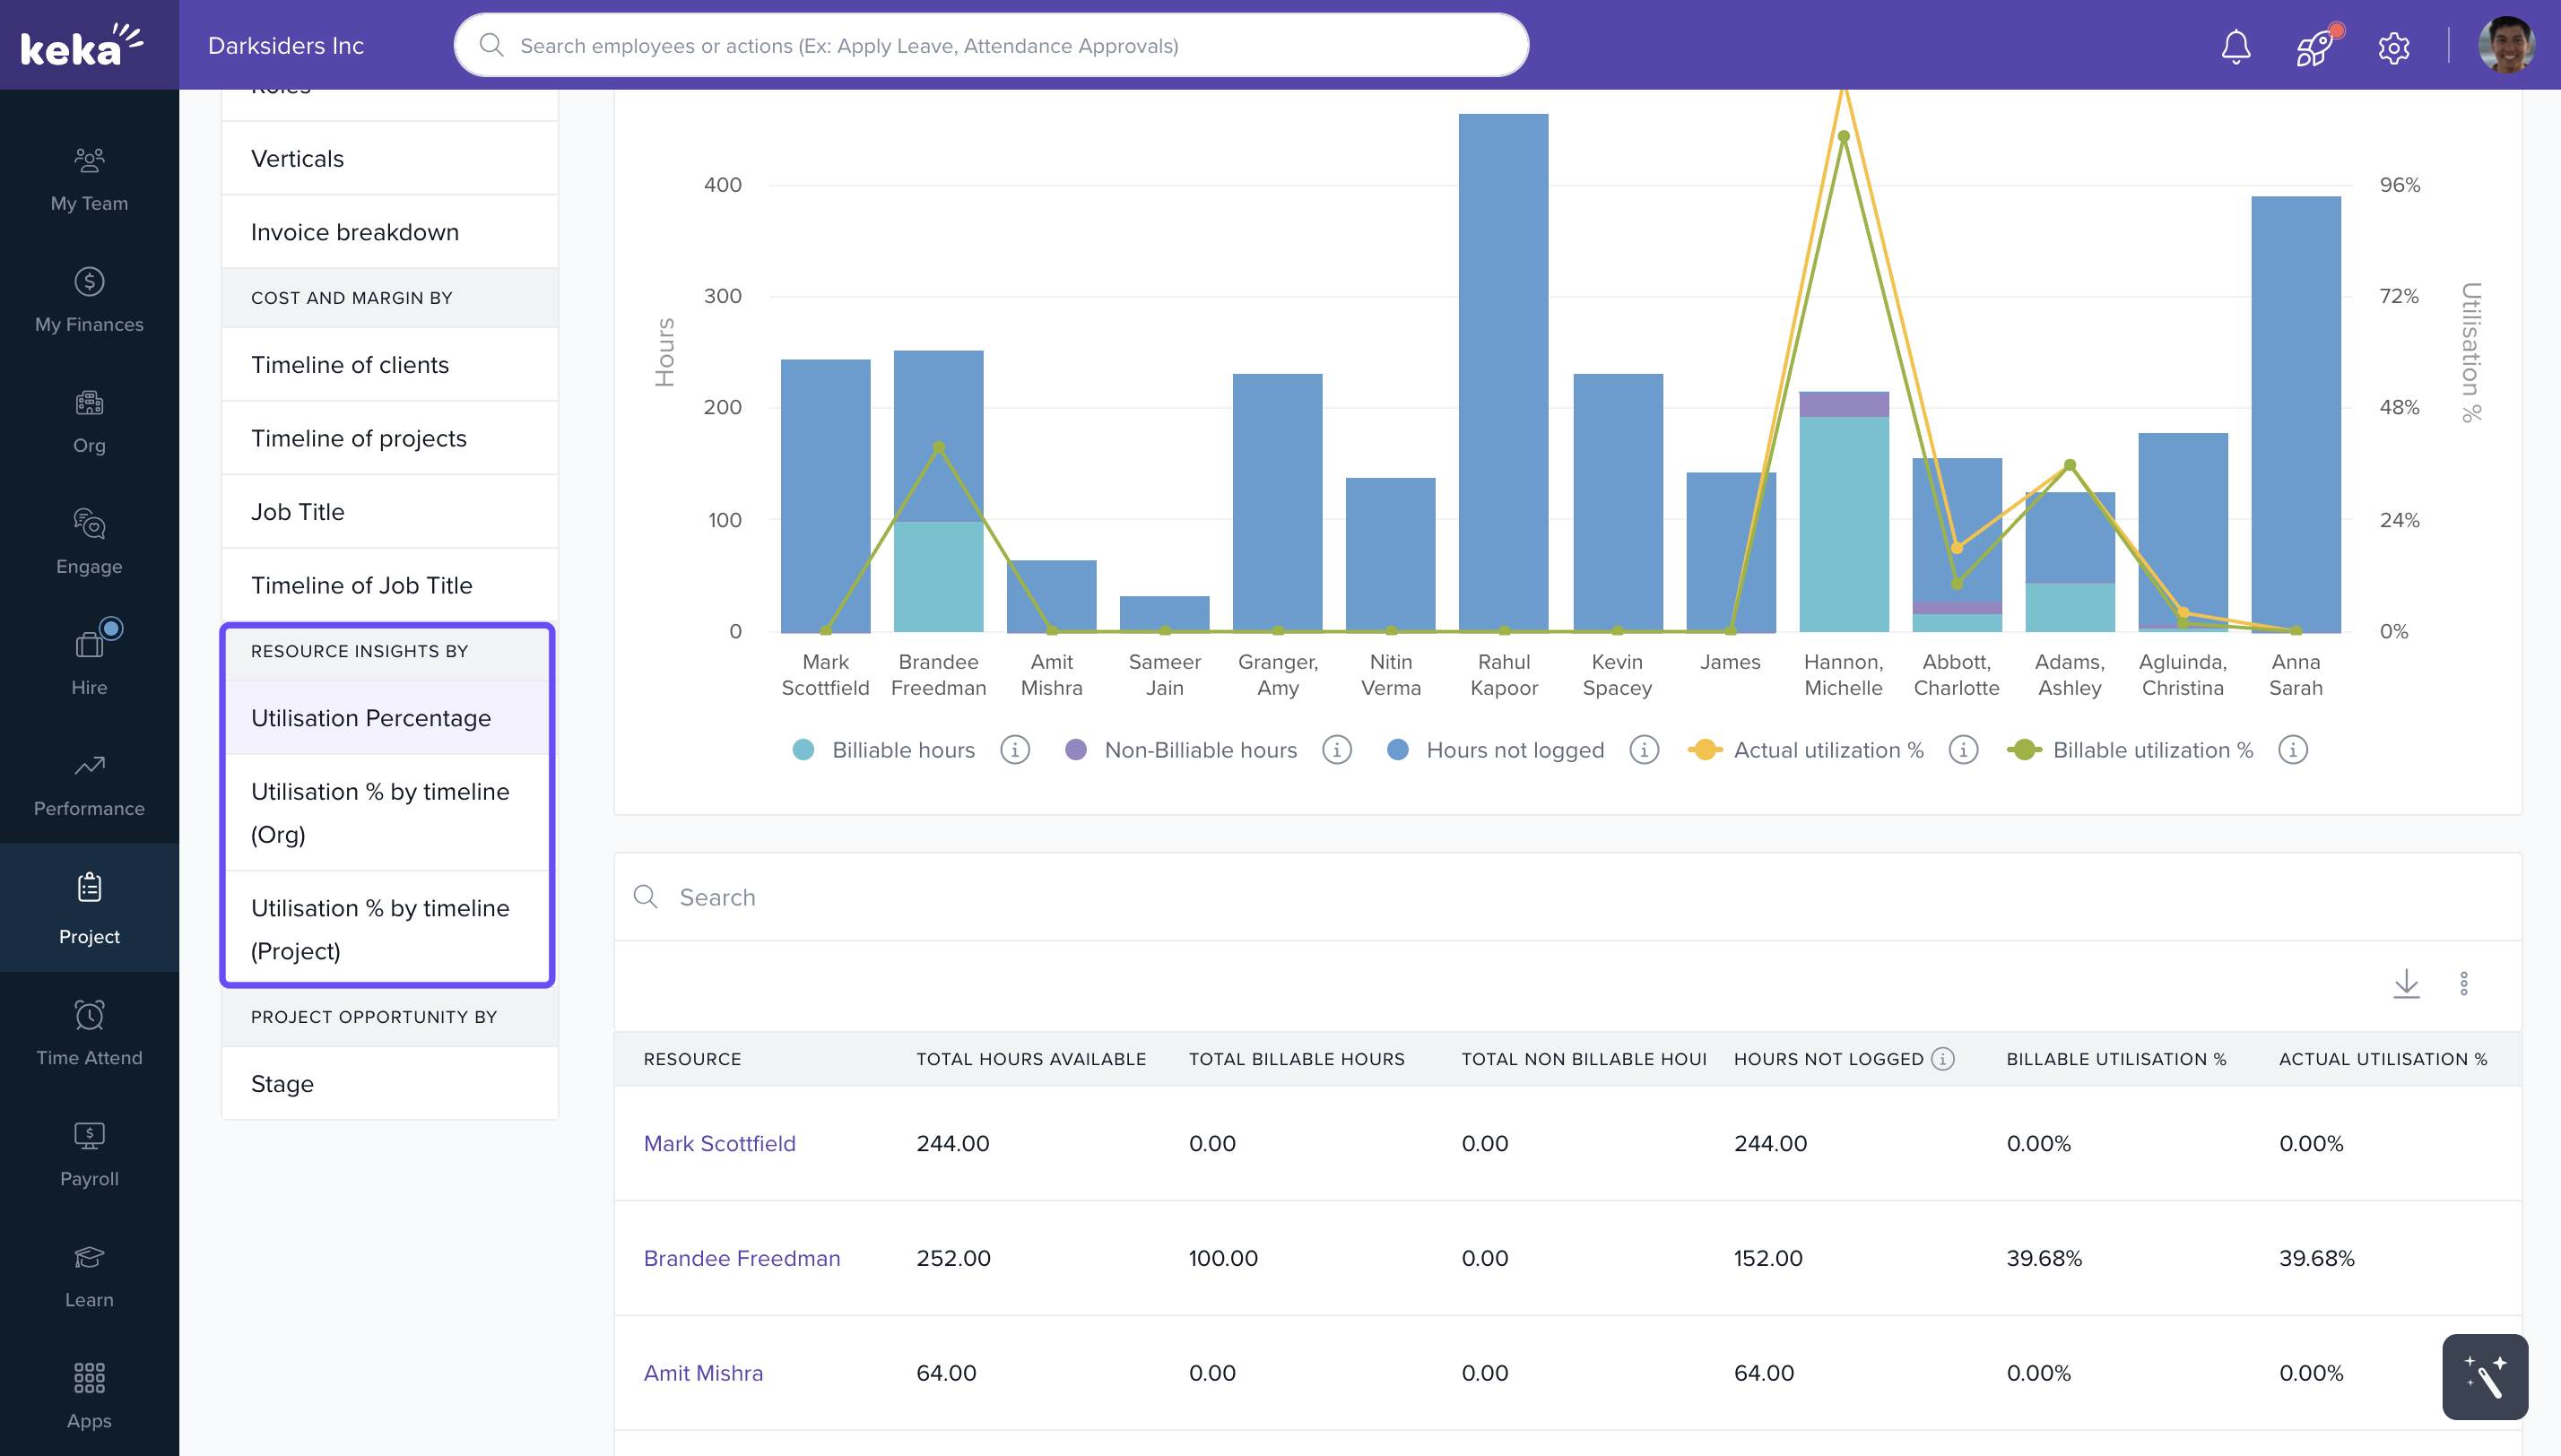
-
Resource Utilization: Track usage percentages and identify under- or over-utilized team members.
-
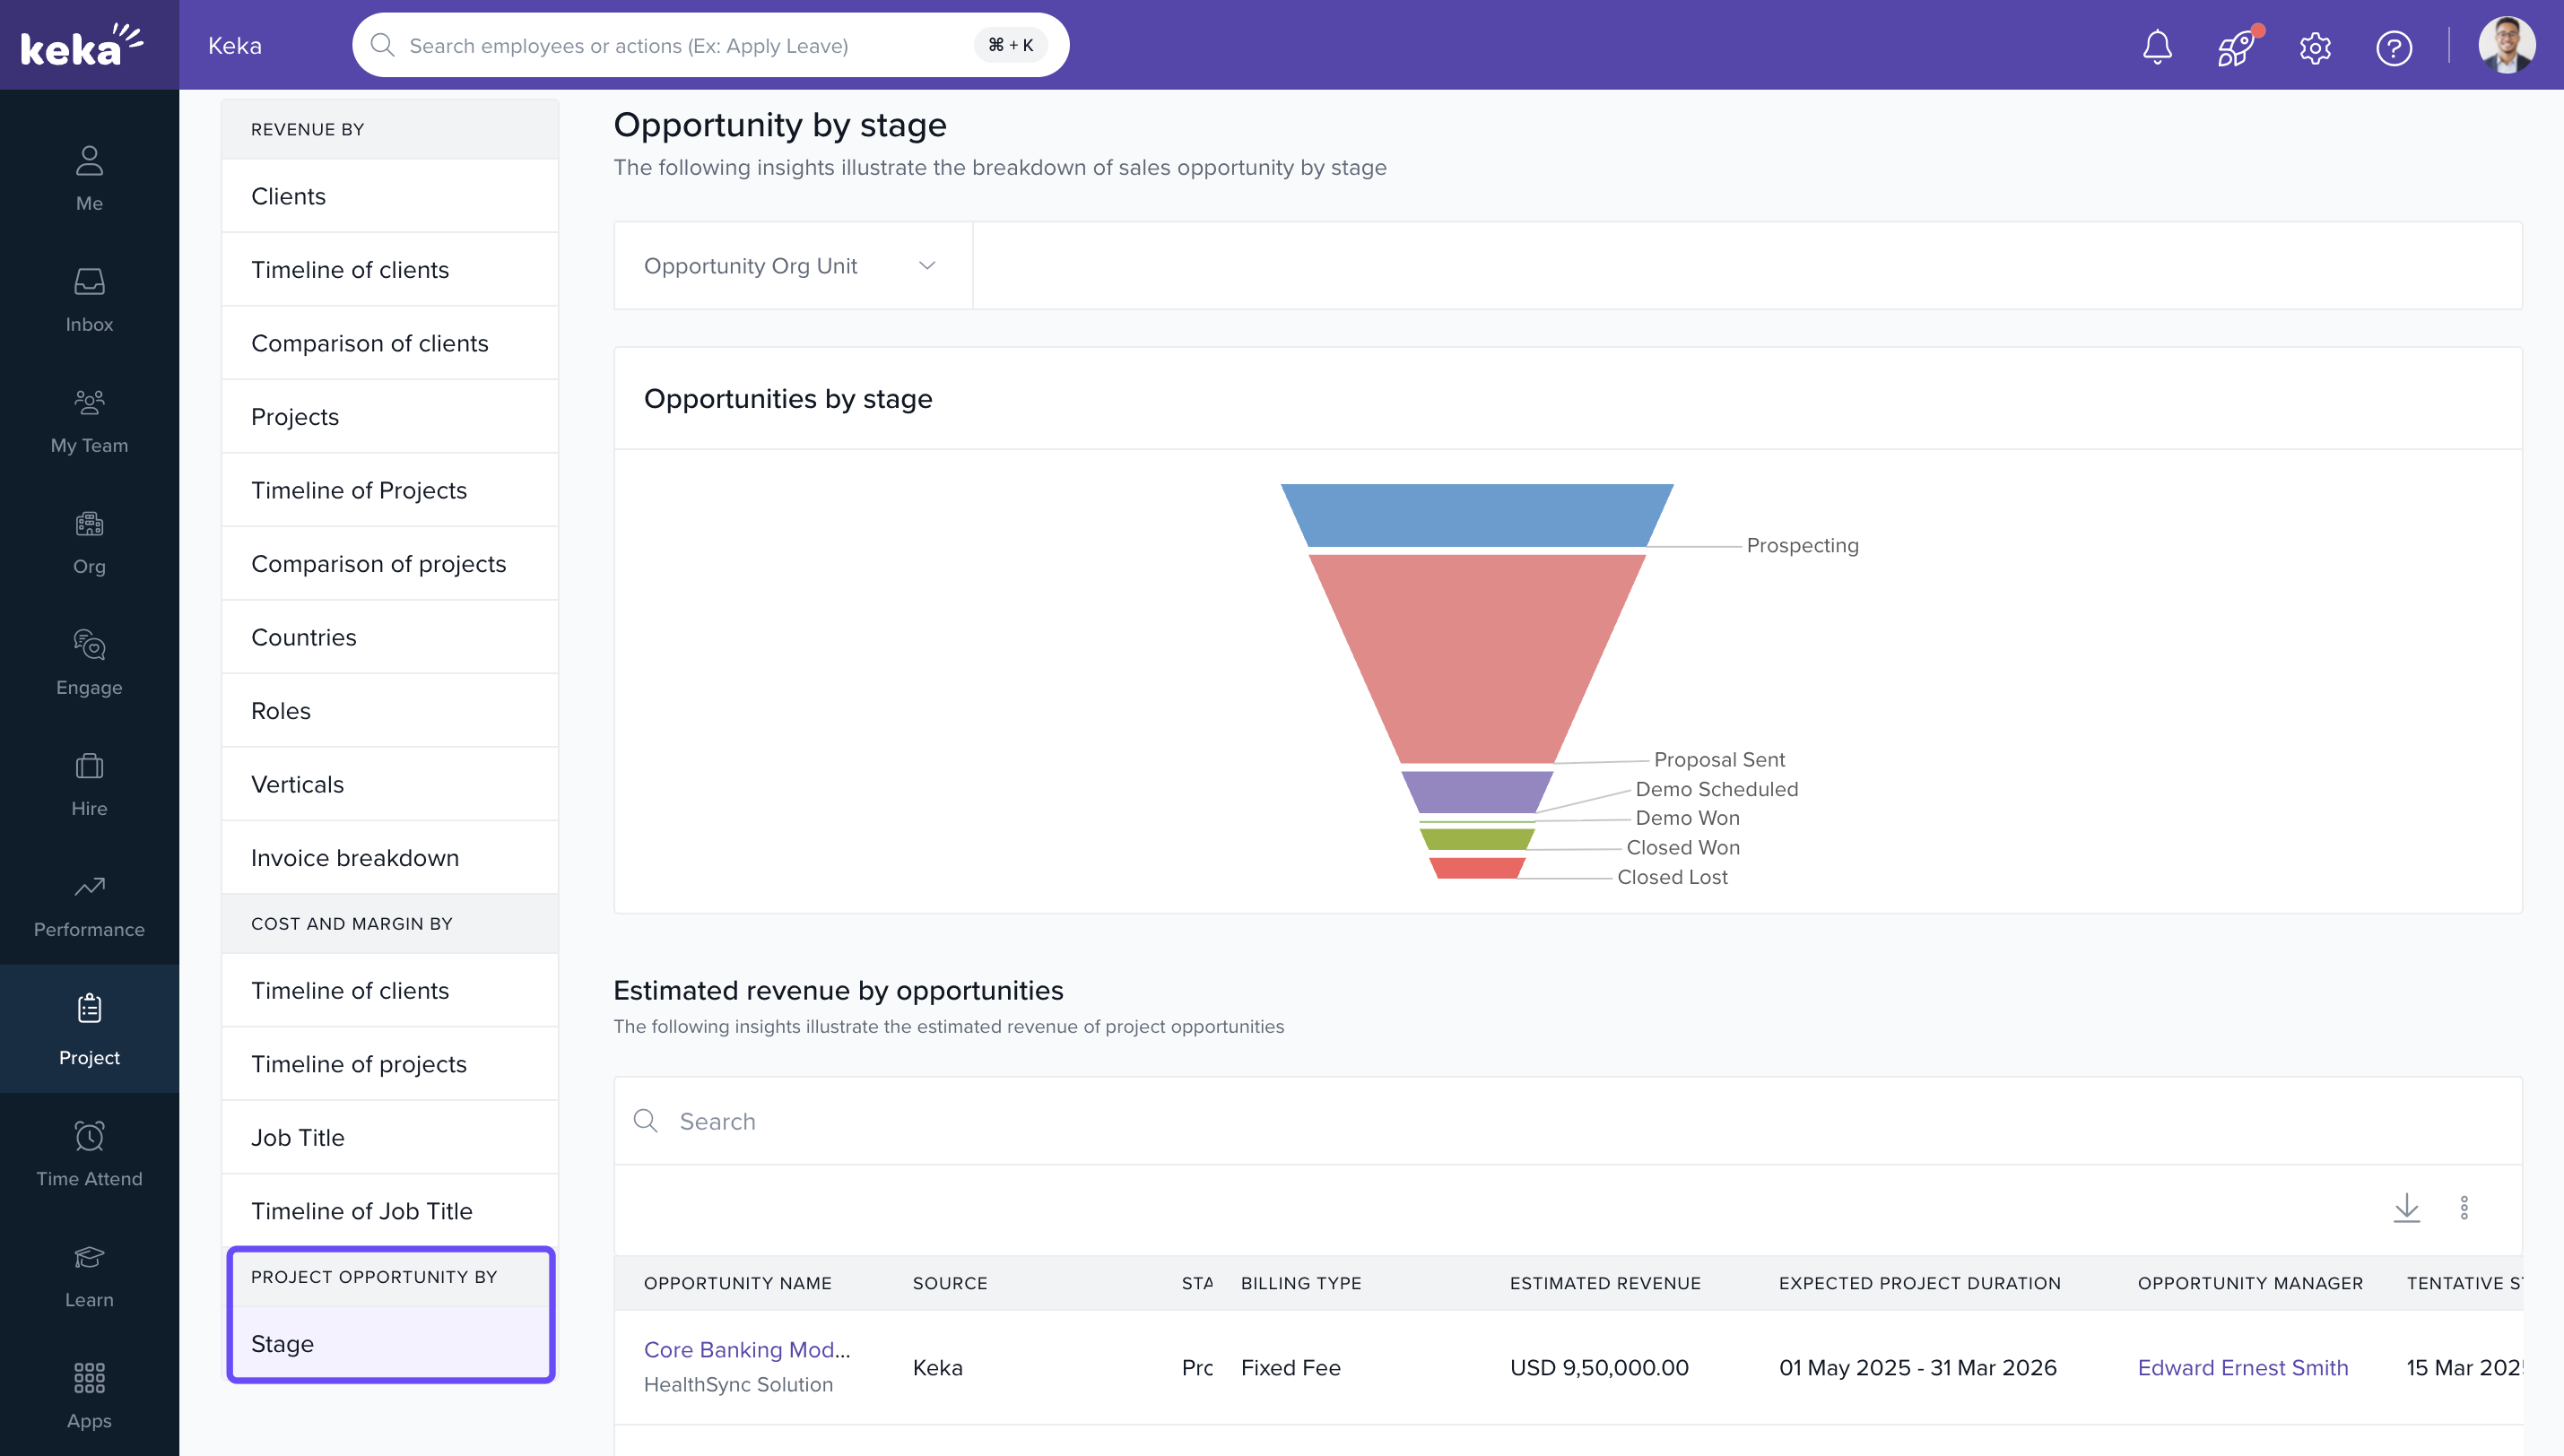
Opportunity Analysis: Assess project conversion likelihood by tracking opportunity pipeline stages.
How It Connects with Other Modules
- Projects: Revenue, costs, and timelines feed directly into analytics.
- Finance: Invoices and billing estimates power financial dashboards.
- Resource Mgmt: Allocation and utilization percentages flow from project staffing.
- Sales/CRM: Opportunity tracking enables forecasting and conversion insights.
FAQs
-
Q: Why don’t I see the Analytics tab?
A: Ensure your plan includes PSA Analytics and that your role has access. -
Q: What data is used in revenue and cost charts?
A: Real-time billing, invoice, and project allocation data are used. -
Q: Can I export the analytics charts or tables?
A: Yes. Use the export or reporting functionality available in the Reports section. -
Q: How often is the data refreshed?
A: Data is updated in near real-time as changes are made across projects.
Troubleshooting
-
No data appearing in charts?
· Confirm you’ve applied filters like project, role, or client.
· Check if the selected date range includes actual project activity. -
Revenue values seem off?
· Ensure correct invoice statuses are included. Pending or draft invoices may be excluded.
For further insights on Reports, simply click on the provided link to delve deeper into the data analysis and reporting functionalities offered within the Keka PSA Analytics module. Reports in Keka PSA
Comments
0 comments
Please sign in to leave a comment.