Overview
In this guide, you will learn:
- How to track resource utilization using Keka PSA Analytics
- Key reports available for project and org-level utilization insights
- How to use data for improving project efficiency and workforce planning
Who Can Do This?
- Project Managers
- Resource Planners
- PSA Admins
Pre-requisites
- Access to the Analytics module in Keka PSA
- Proper role permissions to view project insights
Monitor Resource Utilization
- Go to the left navigation pane and select Project.
- Click on the Analytics tab and ensure you're on the Insights tab.
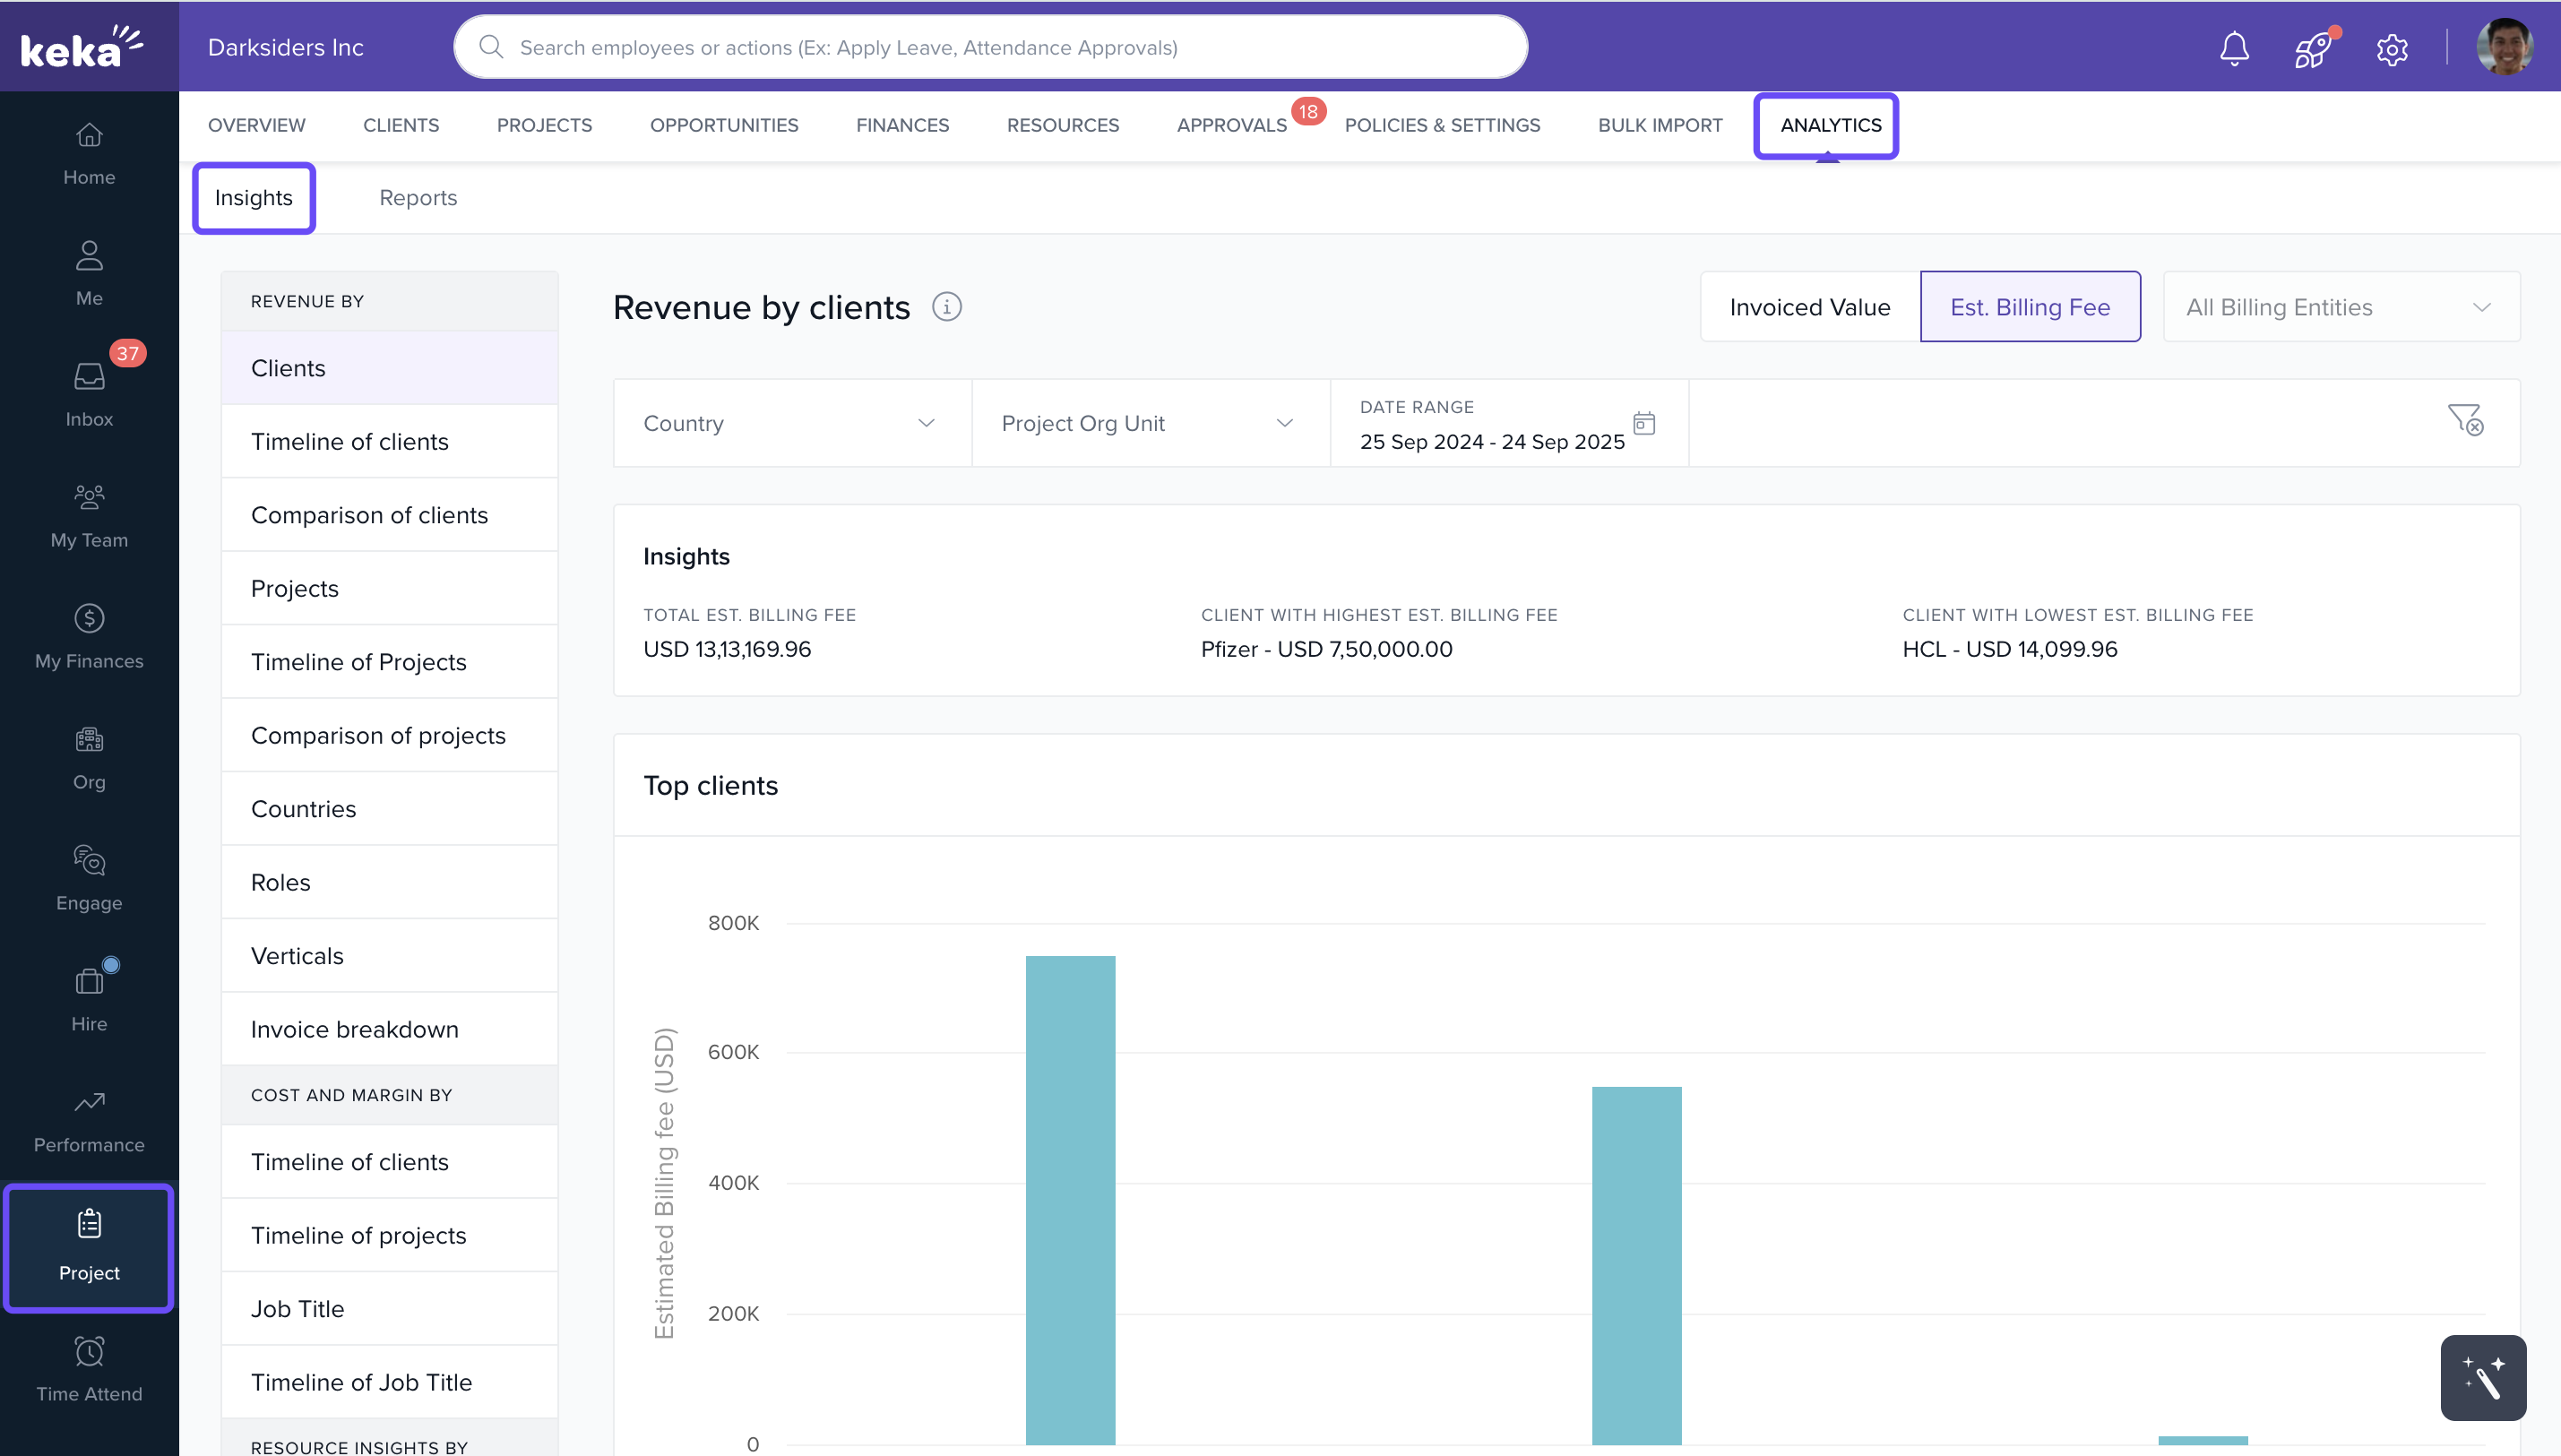
- Scroll to Resource Insights to view utilization reports.
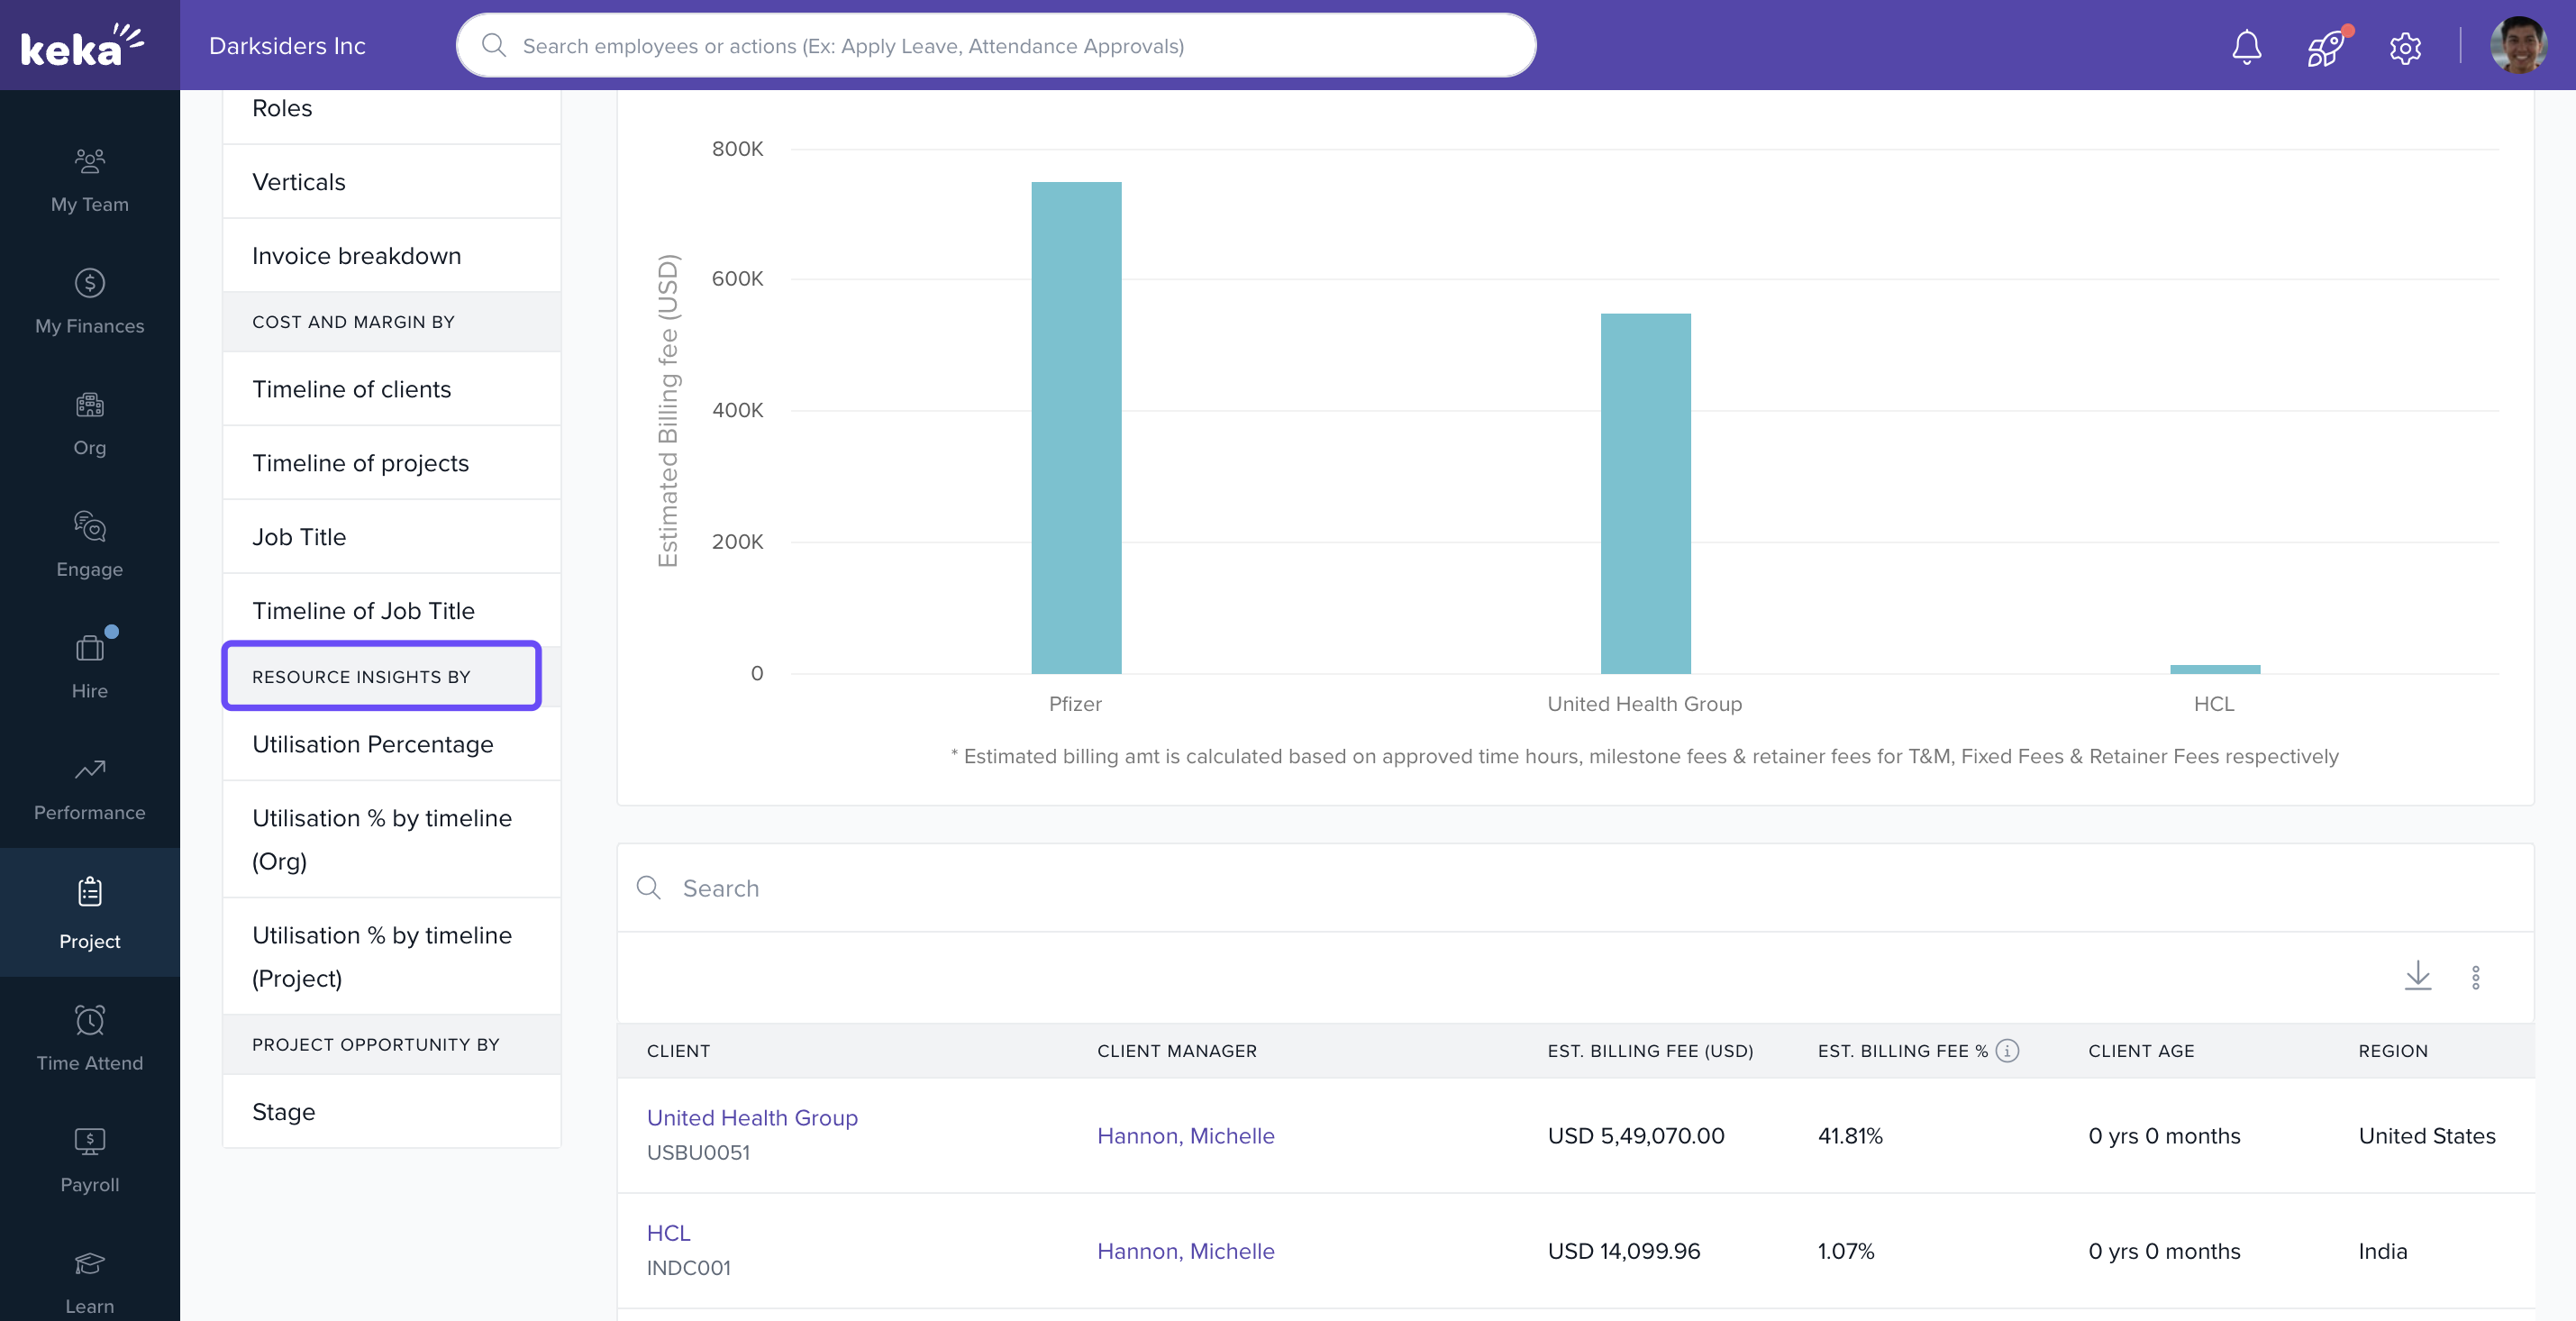
Explore Key Resource Utilization Reports
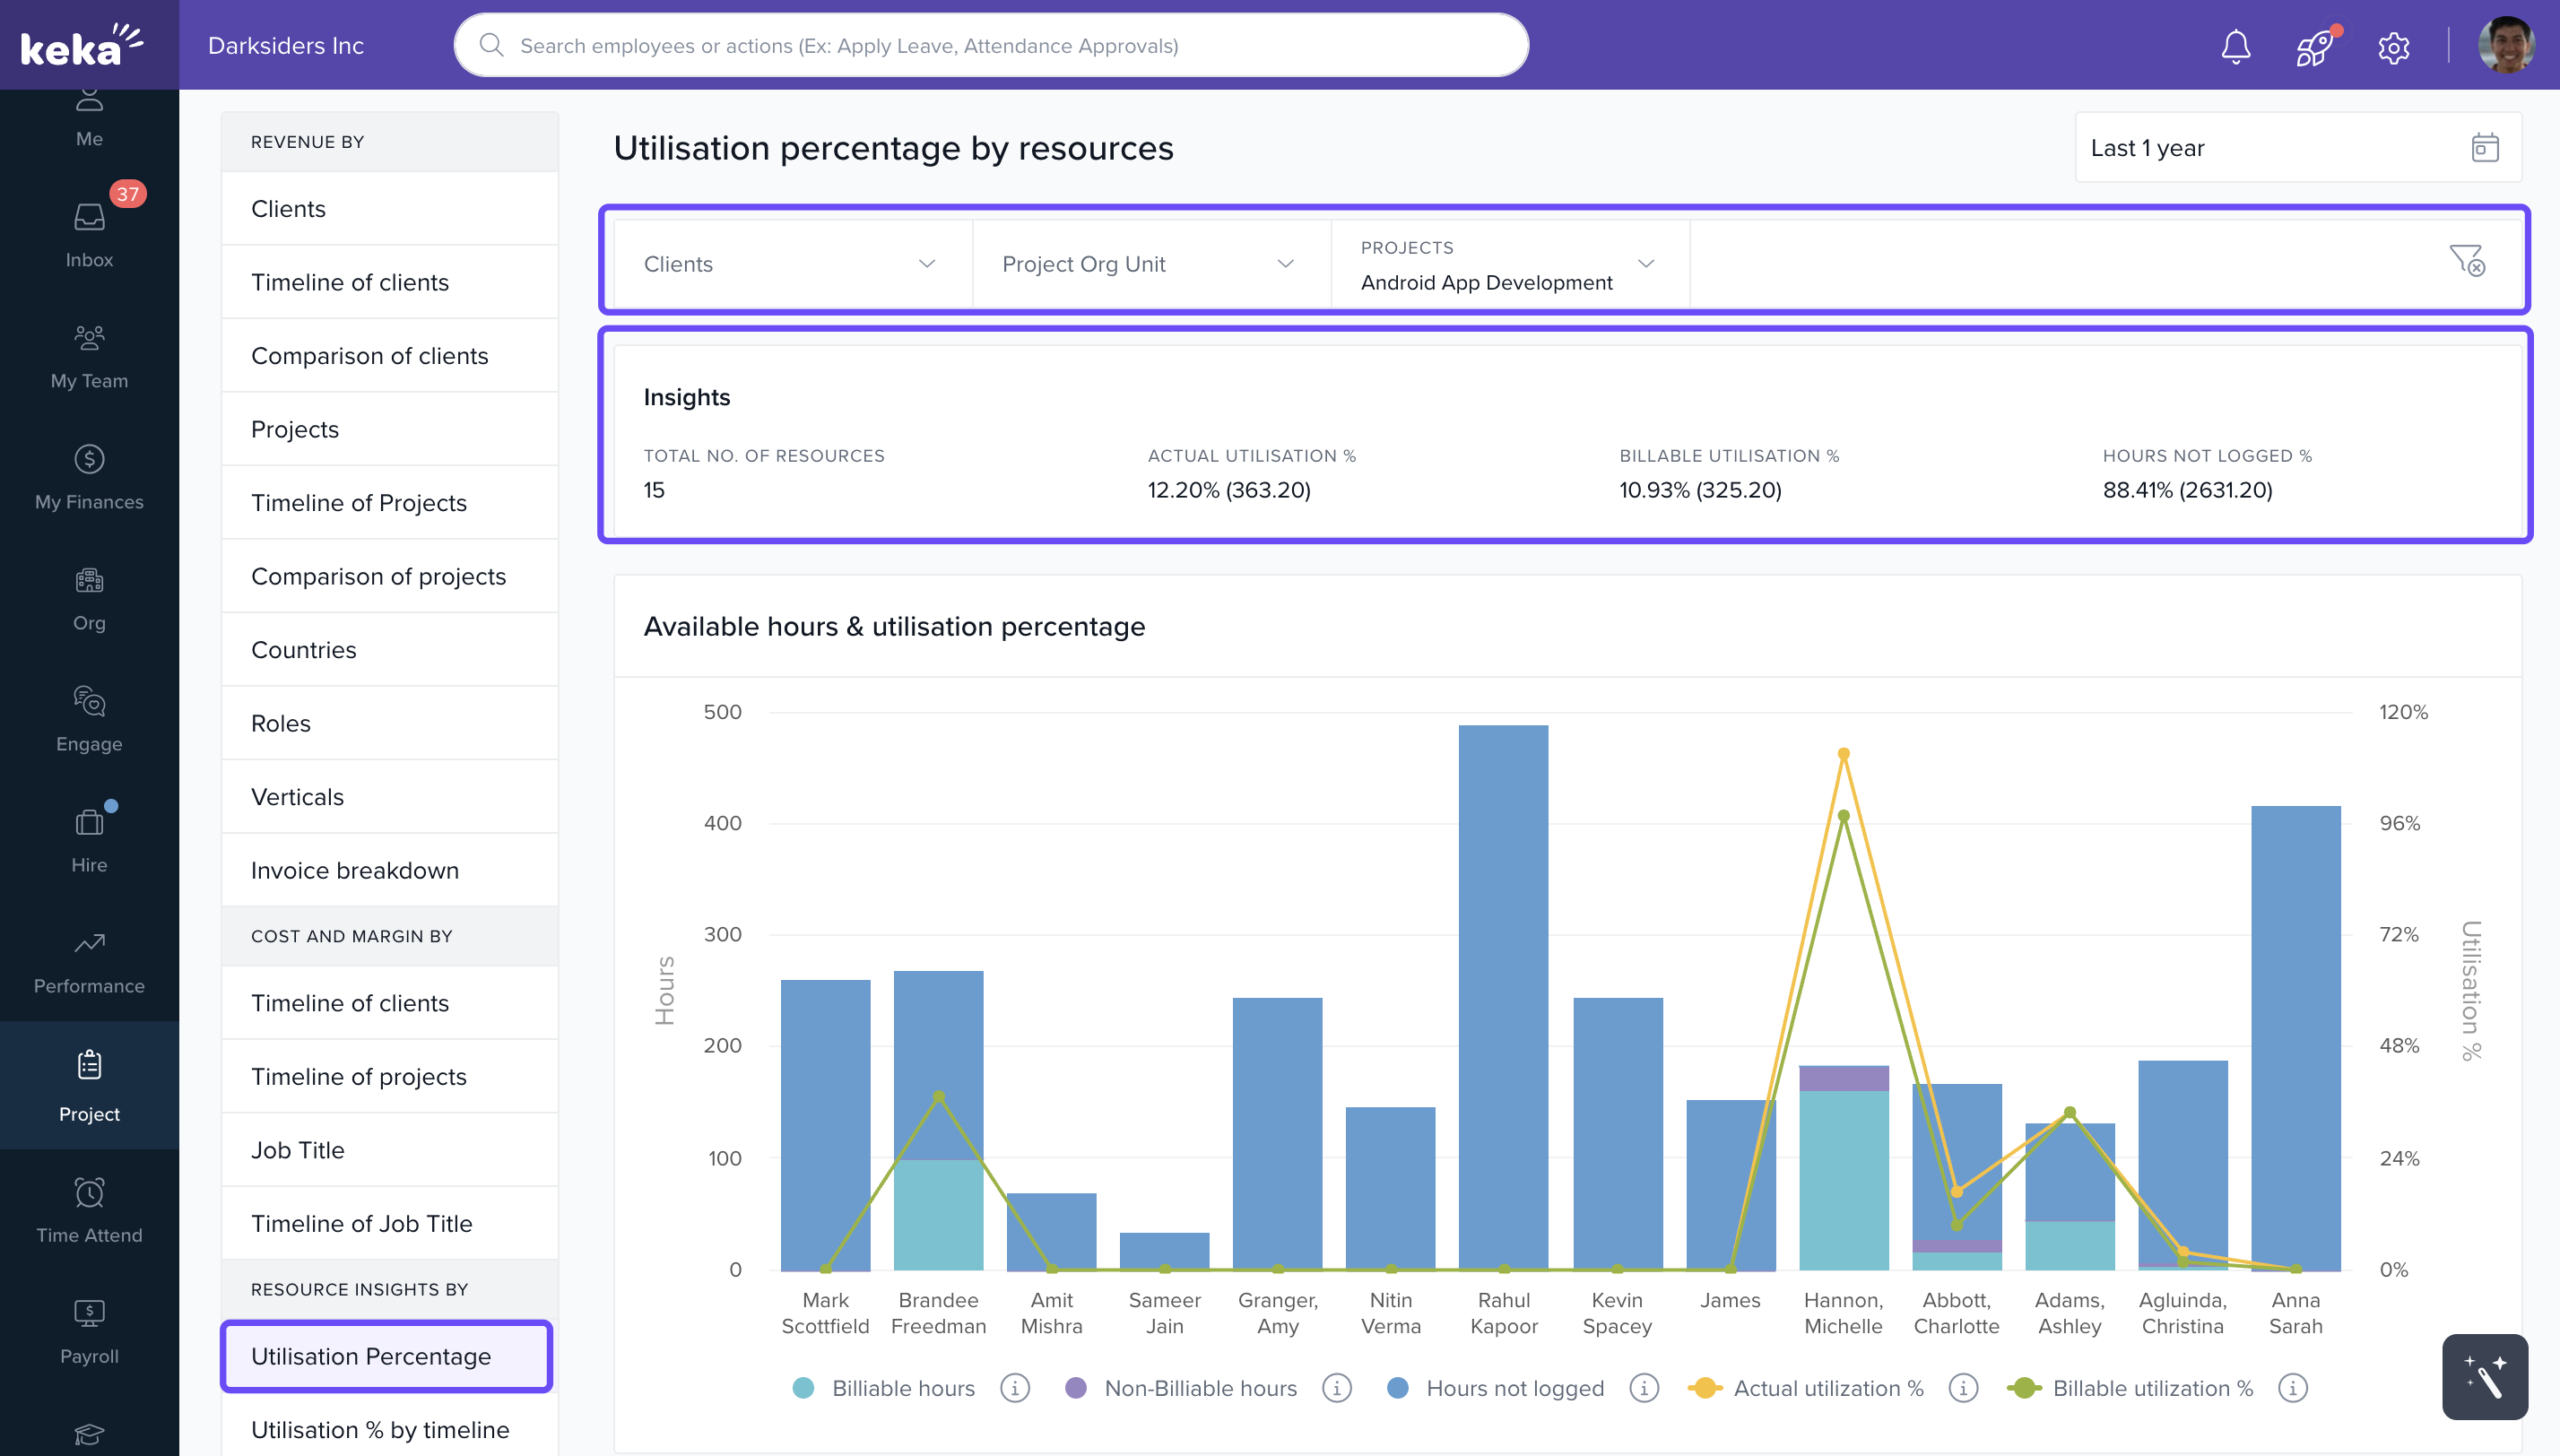
1) Utilization Percentage Report
- What it shows: Project-level breakdown of how each resource is utilized.
-
Steps:
- Select the client and project from drop-down menus.
- View the Available Hours & Utilization Percentage chart.
- Filter by the desired time period.
-
Metrics Tracked:
- Actual Utilization (% of total available hours)
- Billable Utilization (% of billable hours)
-
Data Access:
- Hover over bars for detailed hour and utilization values.
- Tabular data available below; click Download to export.
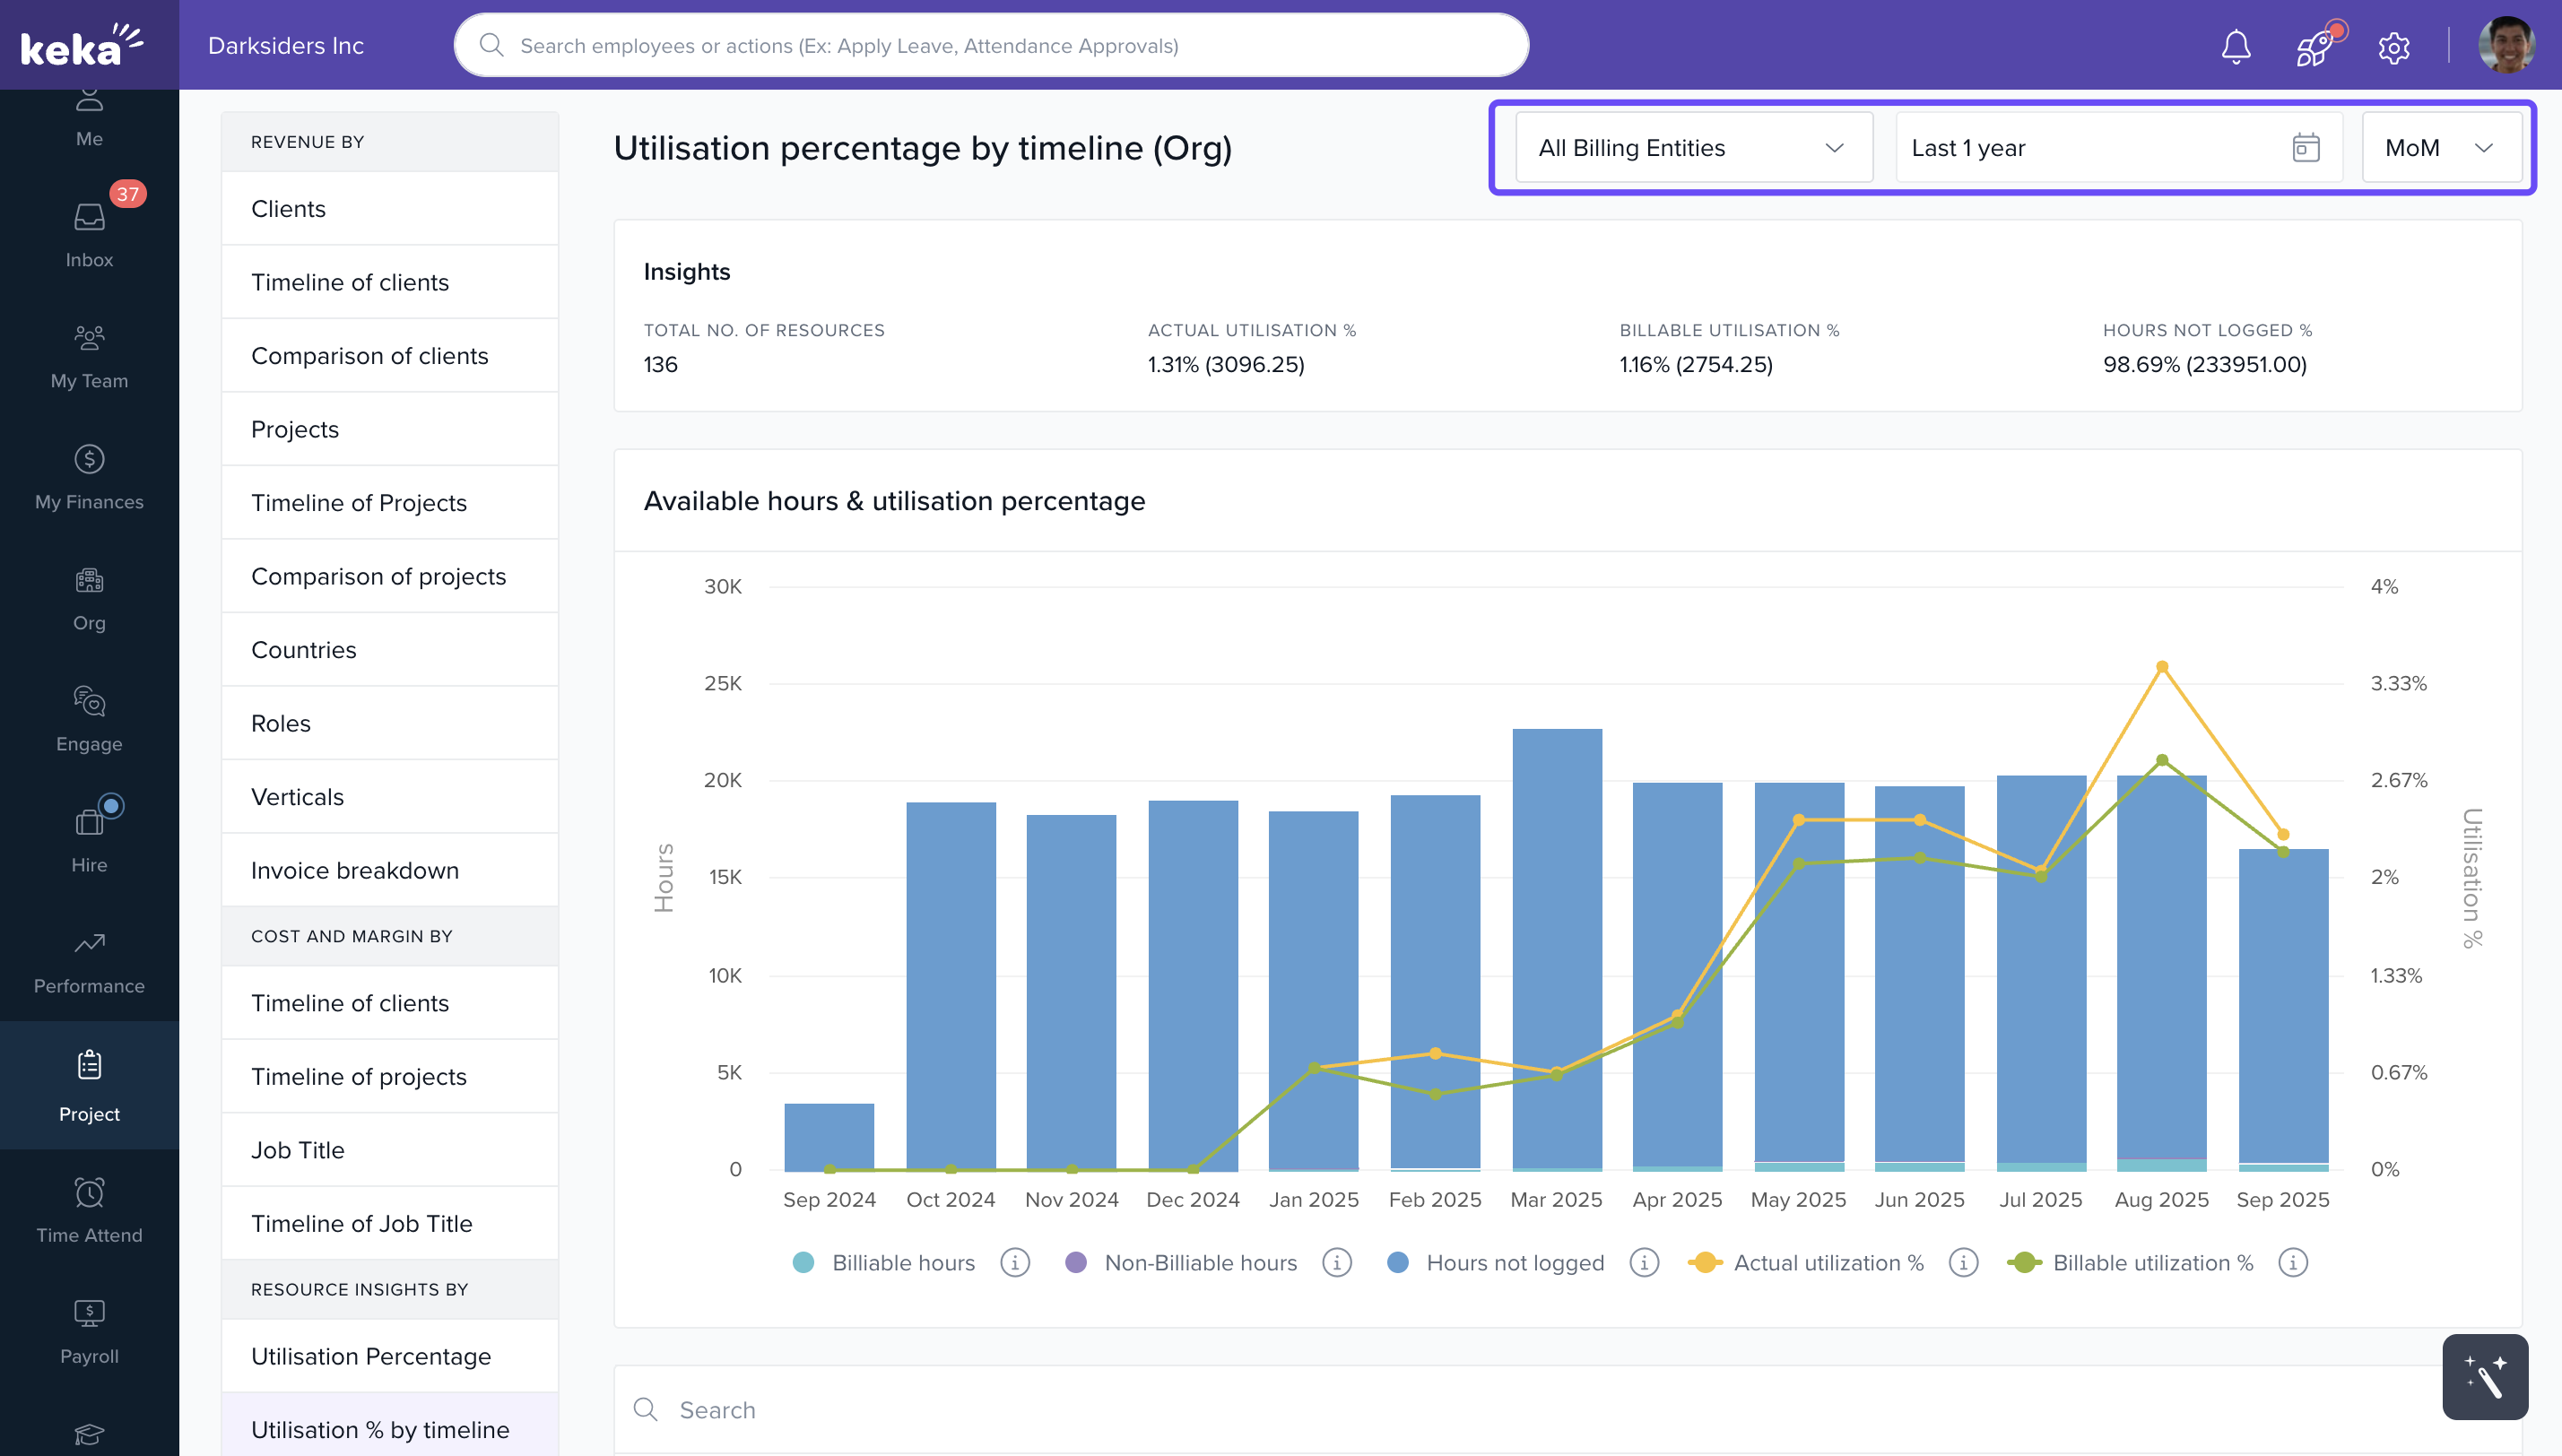
2) Utilization Percentage by Timeline (Organization Level)
- What it shows: Org-wide utilization trends.
-
Steps:
- Choose the billing entity and a timeline (MoM, QoQ, YoY).
- Select a data format to visualize trends.
-
Benefits:
- Spot utilization trends over time.
- Identify fluctuation patterns and optimize staffing.
-
Data Access:
- Hover on chart sections to view utilization data.
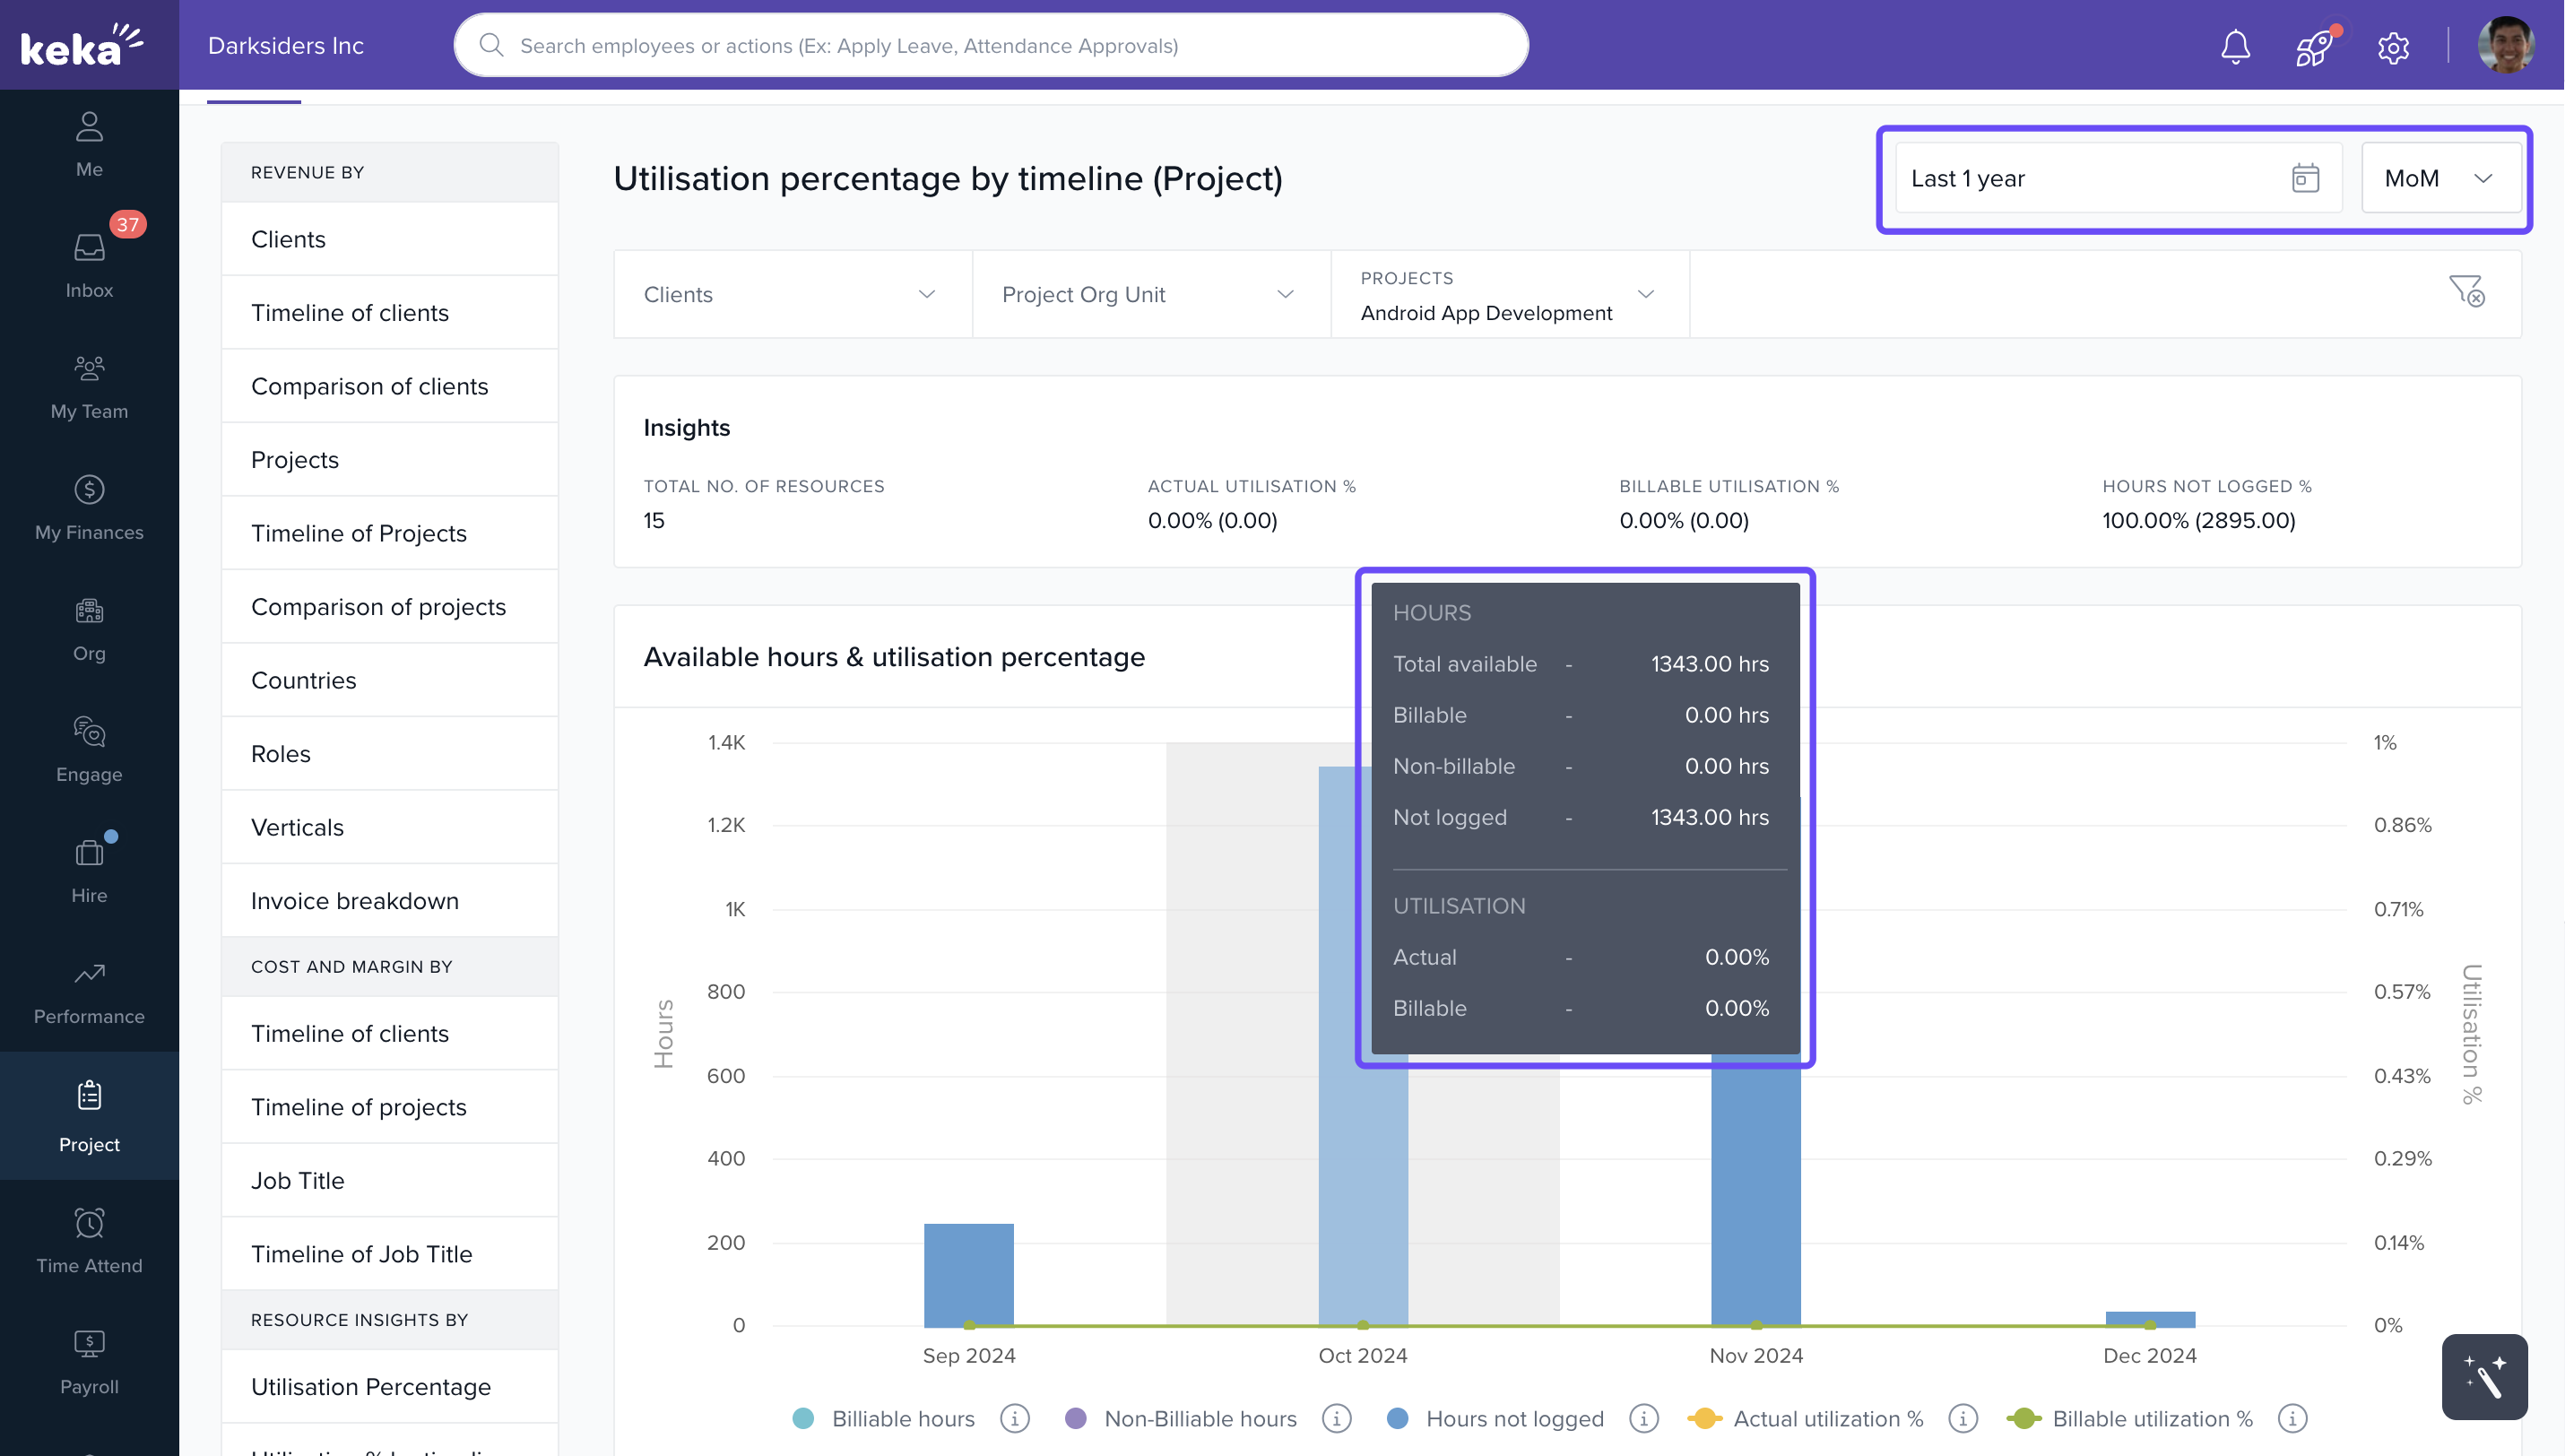
3) Utilization Percentage by Timeline (Project Level)
- What it shows: Trends for a single project.
-
Steps:
- Choose client, project, and time period.
- Group data by Month, Quarter, or Year.
-
Insights Gained:
- Understand how utilization varies per project.
- Make timely resource adjustments.
-
Data Access:
- Hover on the chart for breakdowns.
How It Connects with Other Modules
- Timesheets: Utilization derived from hours logged.
- Billing: Supports planning for billable vs. non-billable hours.
- Projects: Helps adjust allocations and plan staffing accordingly.
FAQs
-
Q: How is utilization percentage calculated?
A: It’s the ratio of logged hours to available hours (actual and billable calculated separately). -
Q: Can I download utilization data?
A: Yes, every chart has a download icon for exporting data. -
Q: Can I analyze data by quarter or year?
A: Yes, MoM, QoQ, and YoY views are available at both org and project levels.
Troubleshooting
-
No data showing in reports?
- Ensure timesheet entries are submitted and approved.
- Verify that filters (project, date, billing entity) are correctly applied.
For additional insights and guidance, please explore our resource titled : Unlocking Your Business Potential with Keka PSA Analytics
Comments
0 comments
Please sign in to leave a comment.