Introduction
The Expenses & Travel Dashboard in Keka offers a quick visual summary of your organization’s spending. Its intuitive charts and filters help you identify key trends, spots of concern, and areas for improvement—whether at the team, location, or category level.
TABLE OF CONTENTS
1. Access the Dashboard
-
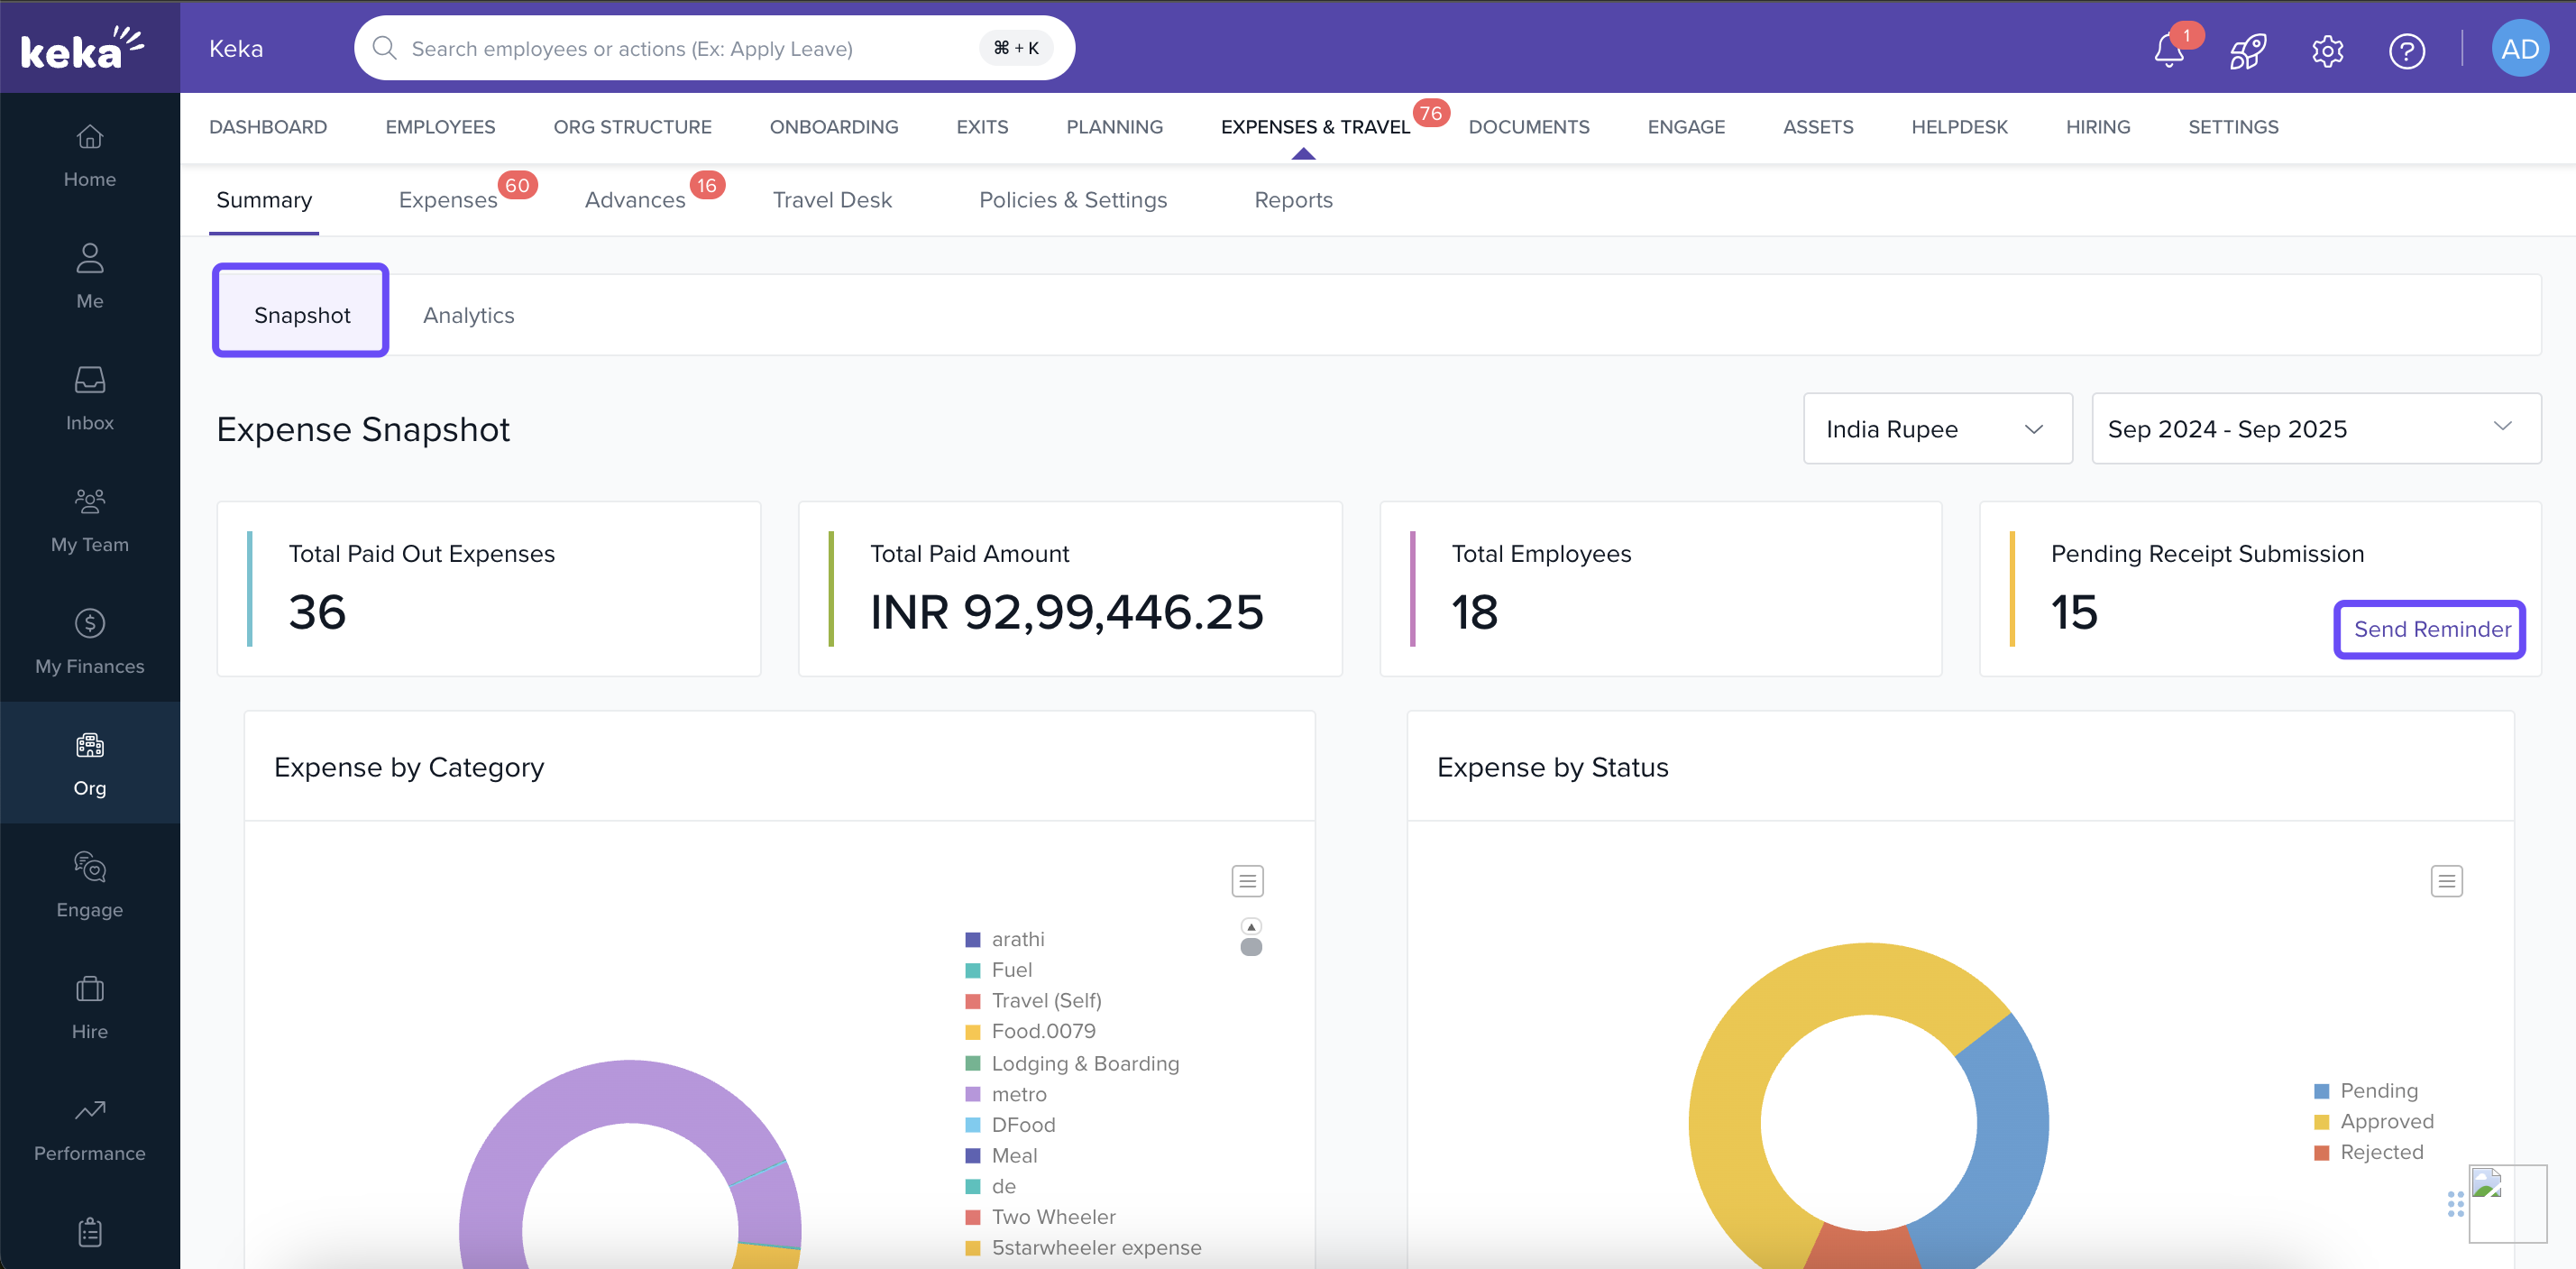
In the left navigation panel, click Org.
-
Select Expenses & Travel, then it opens the Summary tab by default.
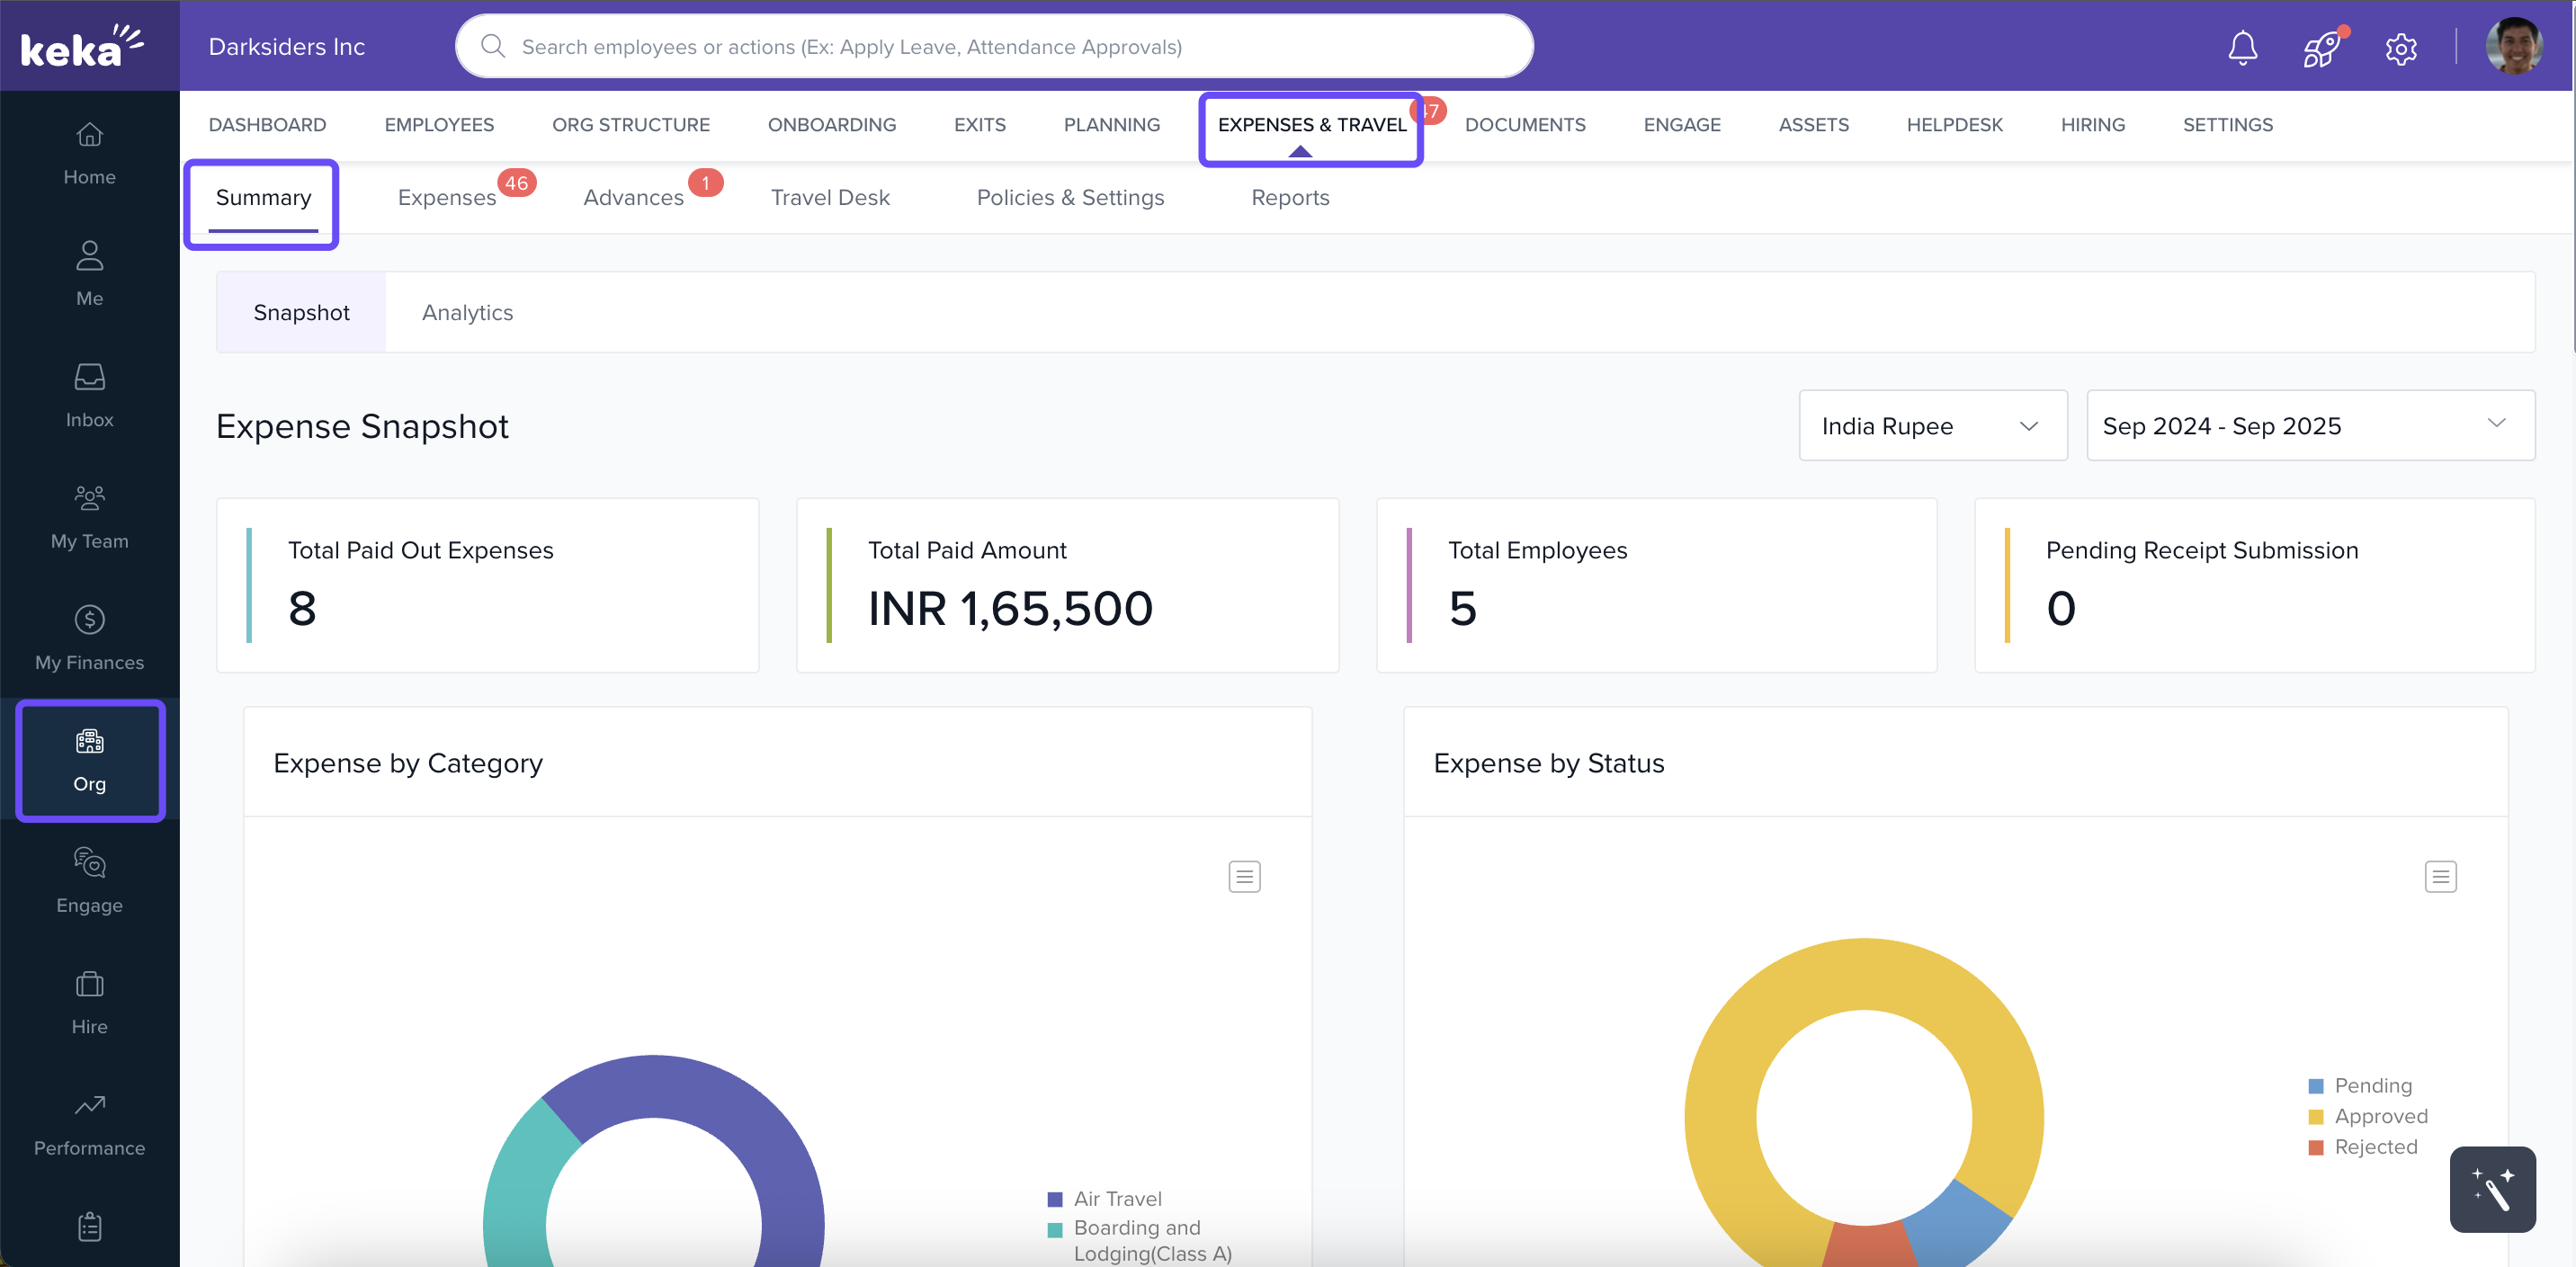
2. Snapshot Tab — Get Your Overview
The Snapshot tab delivers a high-level look at expense metrics:
-
Expenses Snapshot widget displays:
-
Total amount disbursed
-
Number of paid expense claims
-
Count of employees who raised claims
-
Number of pending receipt submissions
-
Quick Send Reminder link for outstanding receipts
-
-
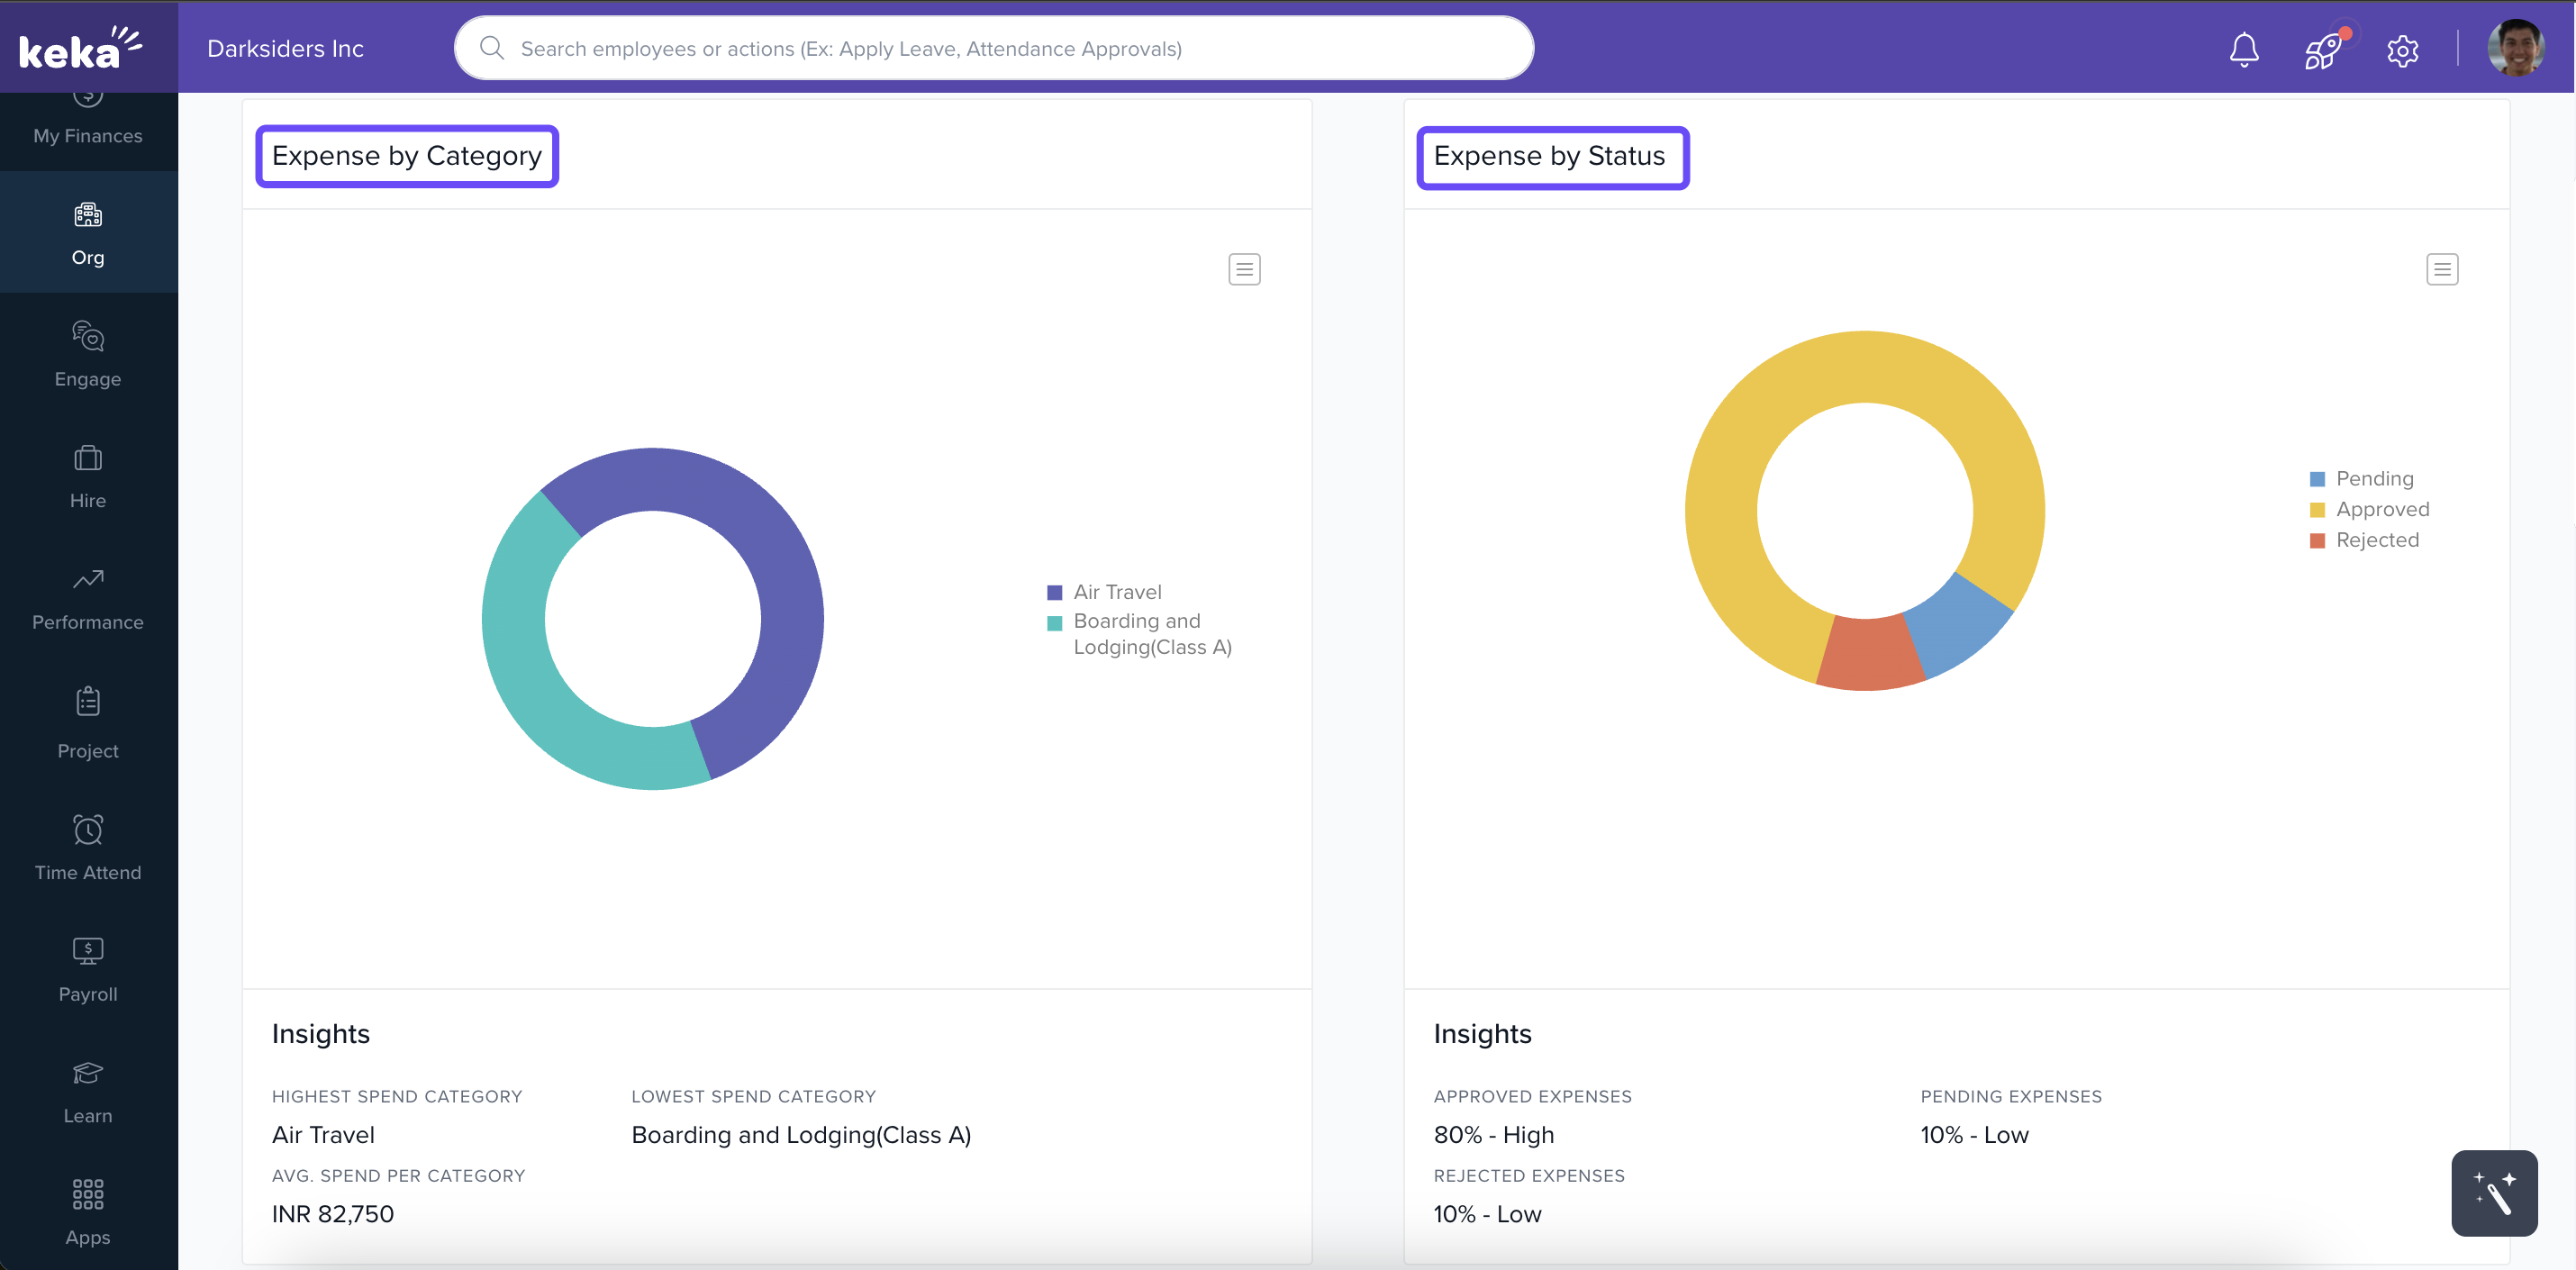
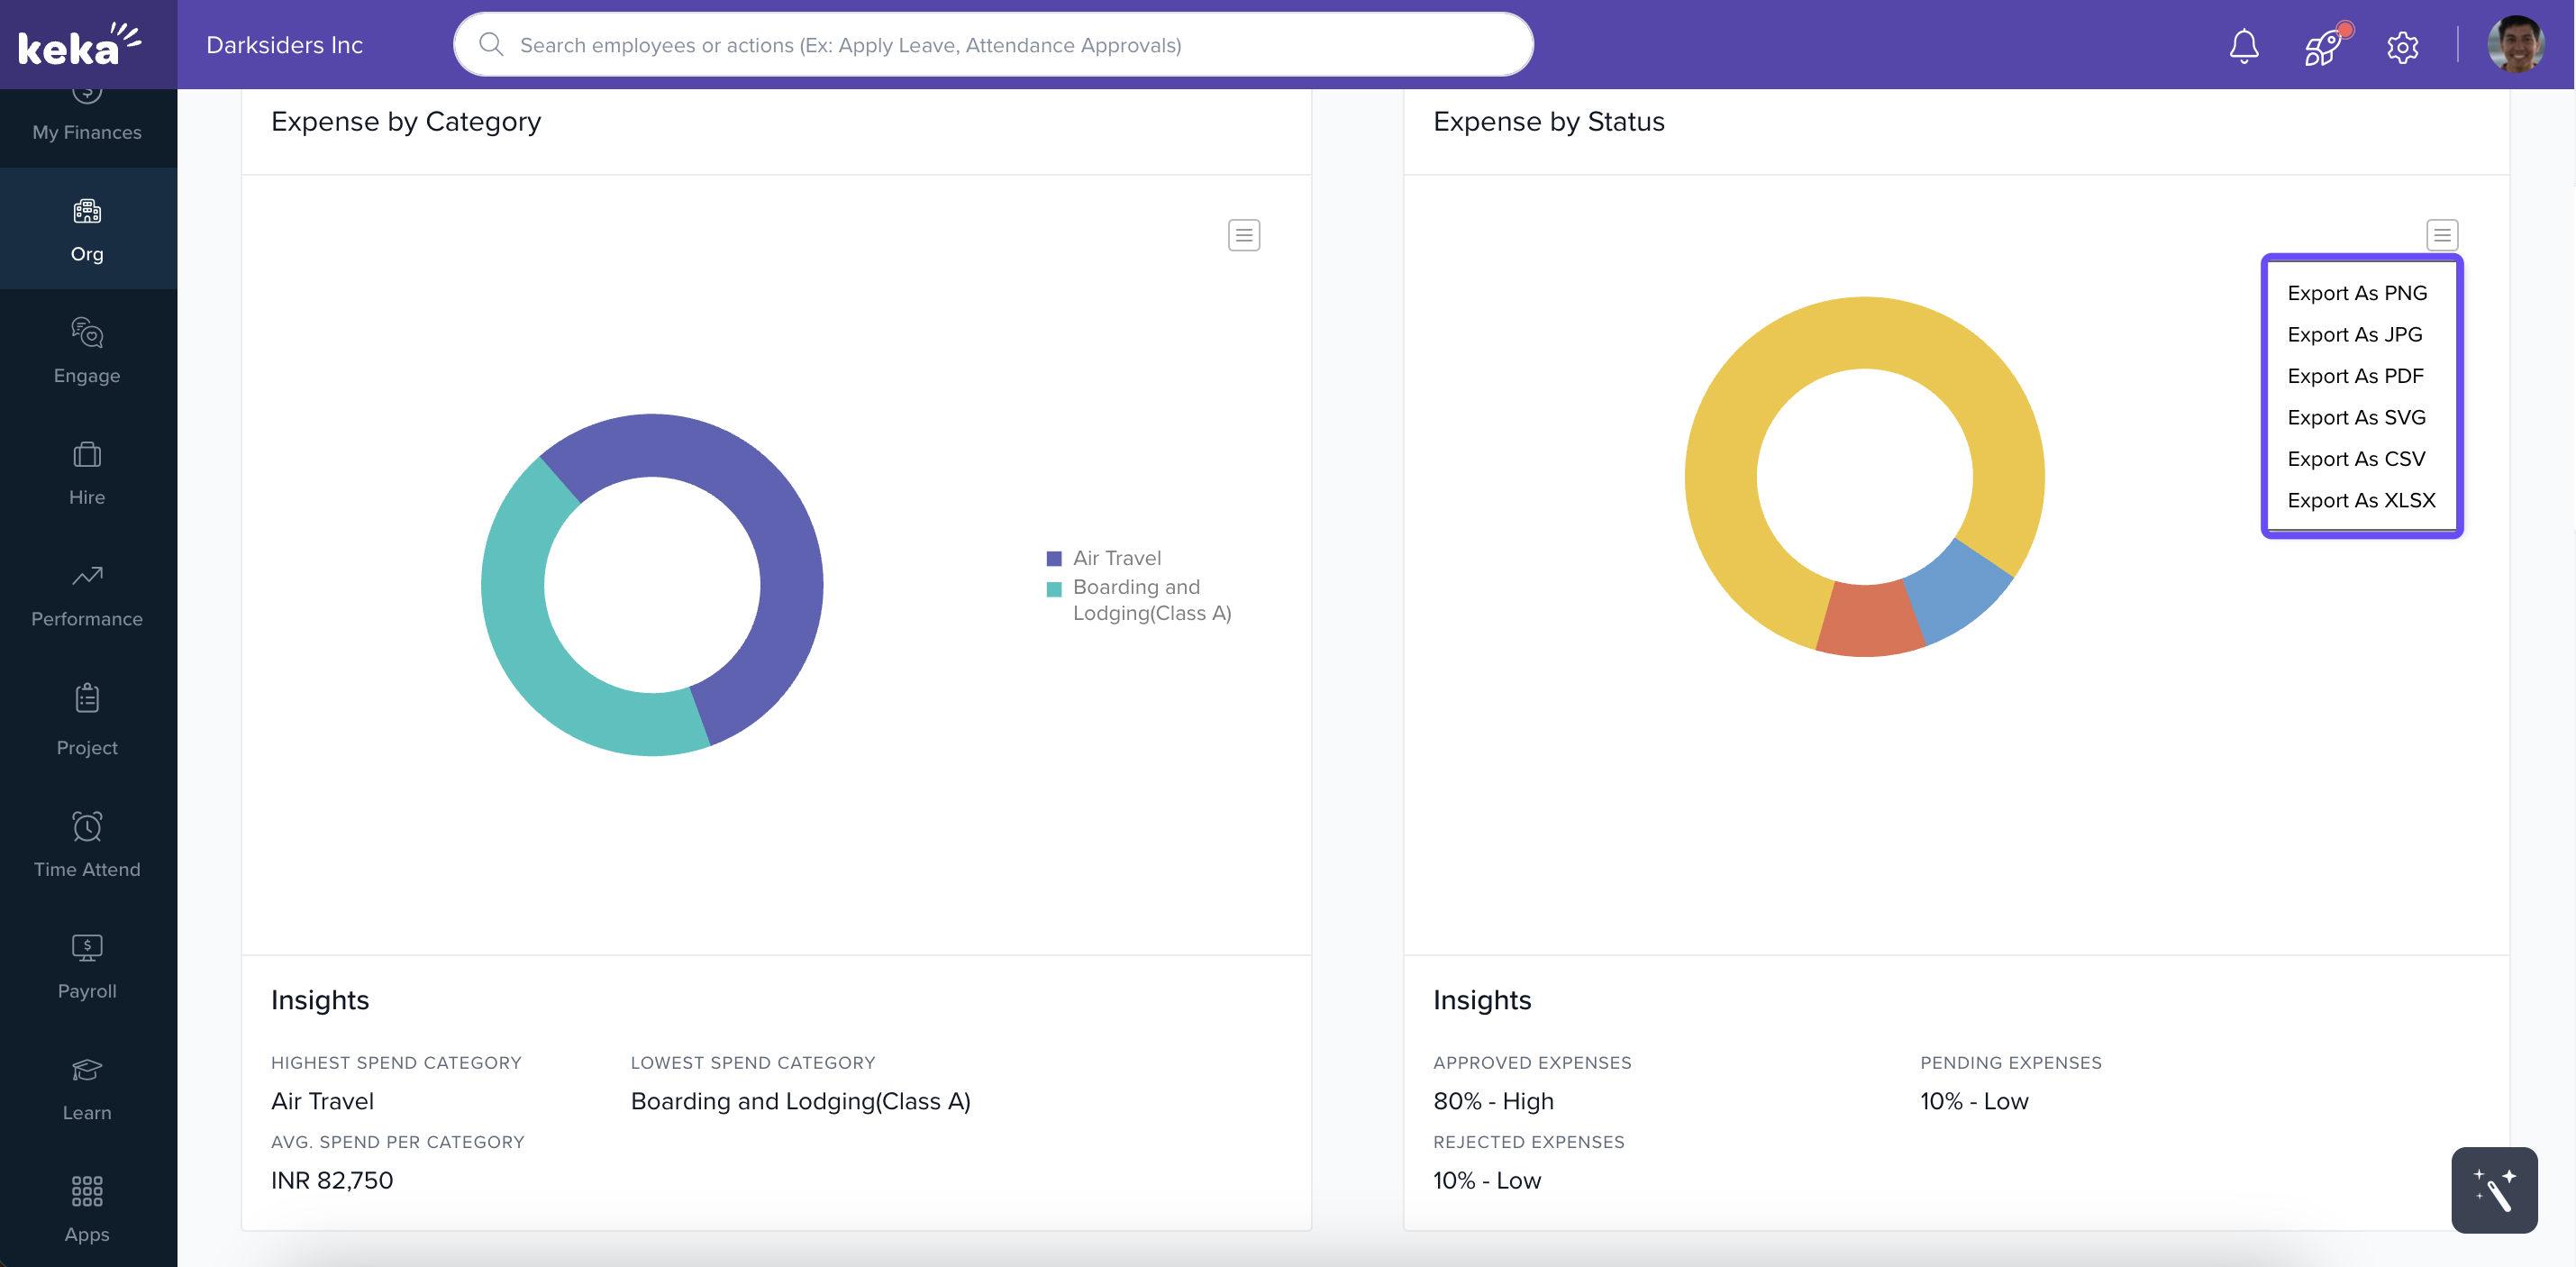
Pie charts breakdown expense claims by category and status, with insights below each chart
-
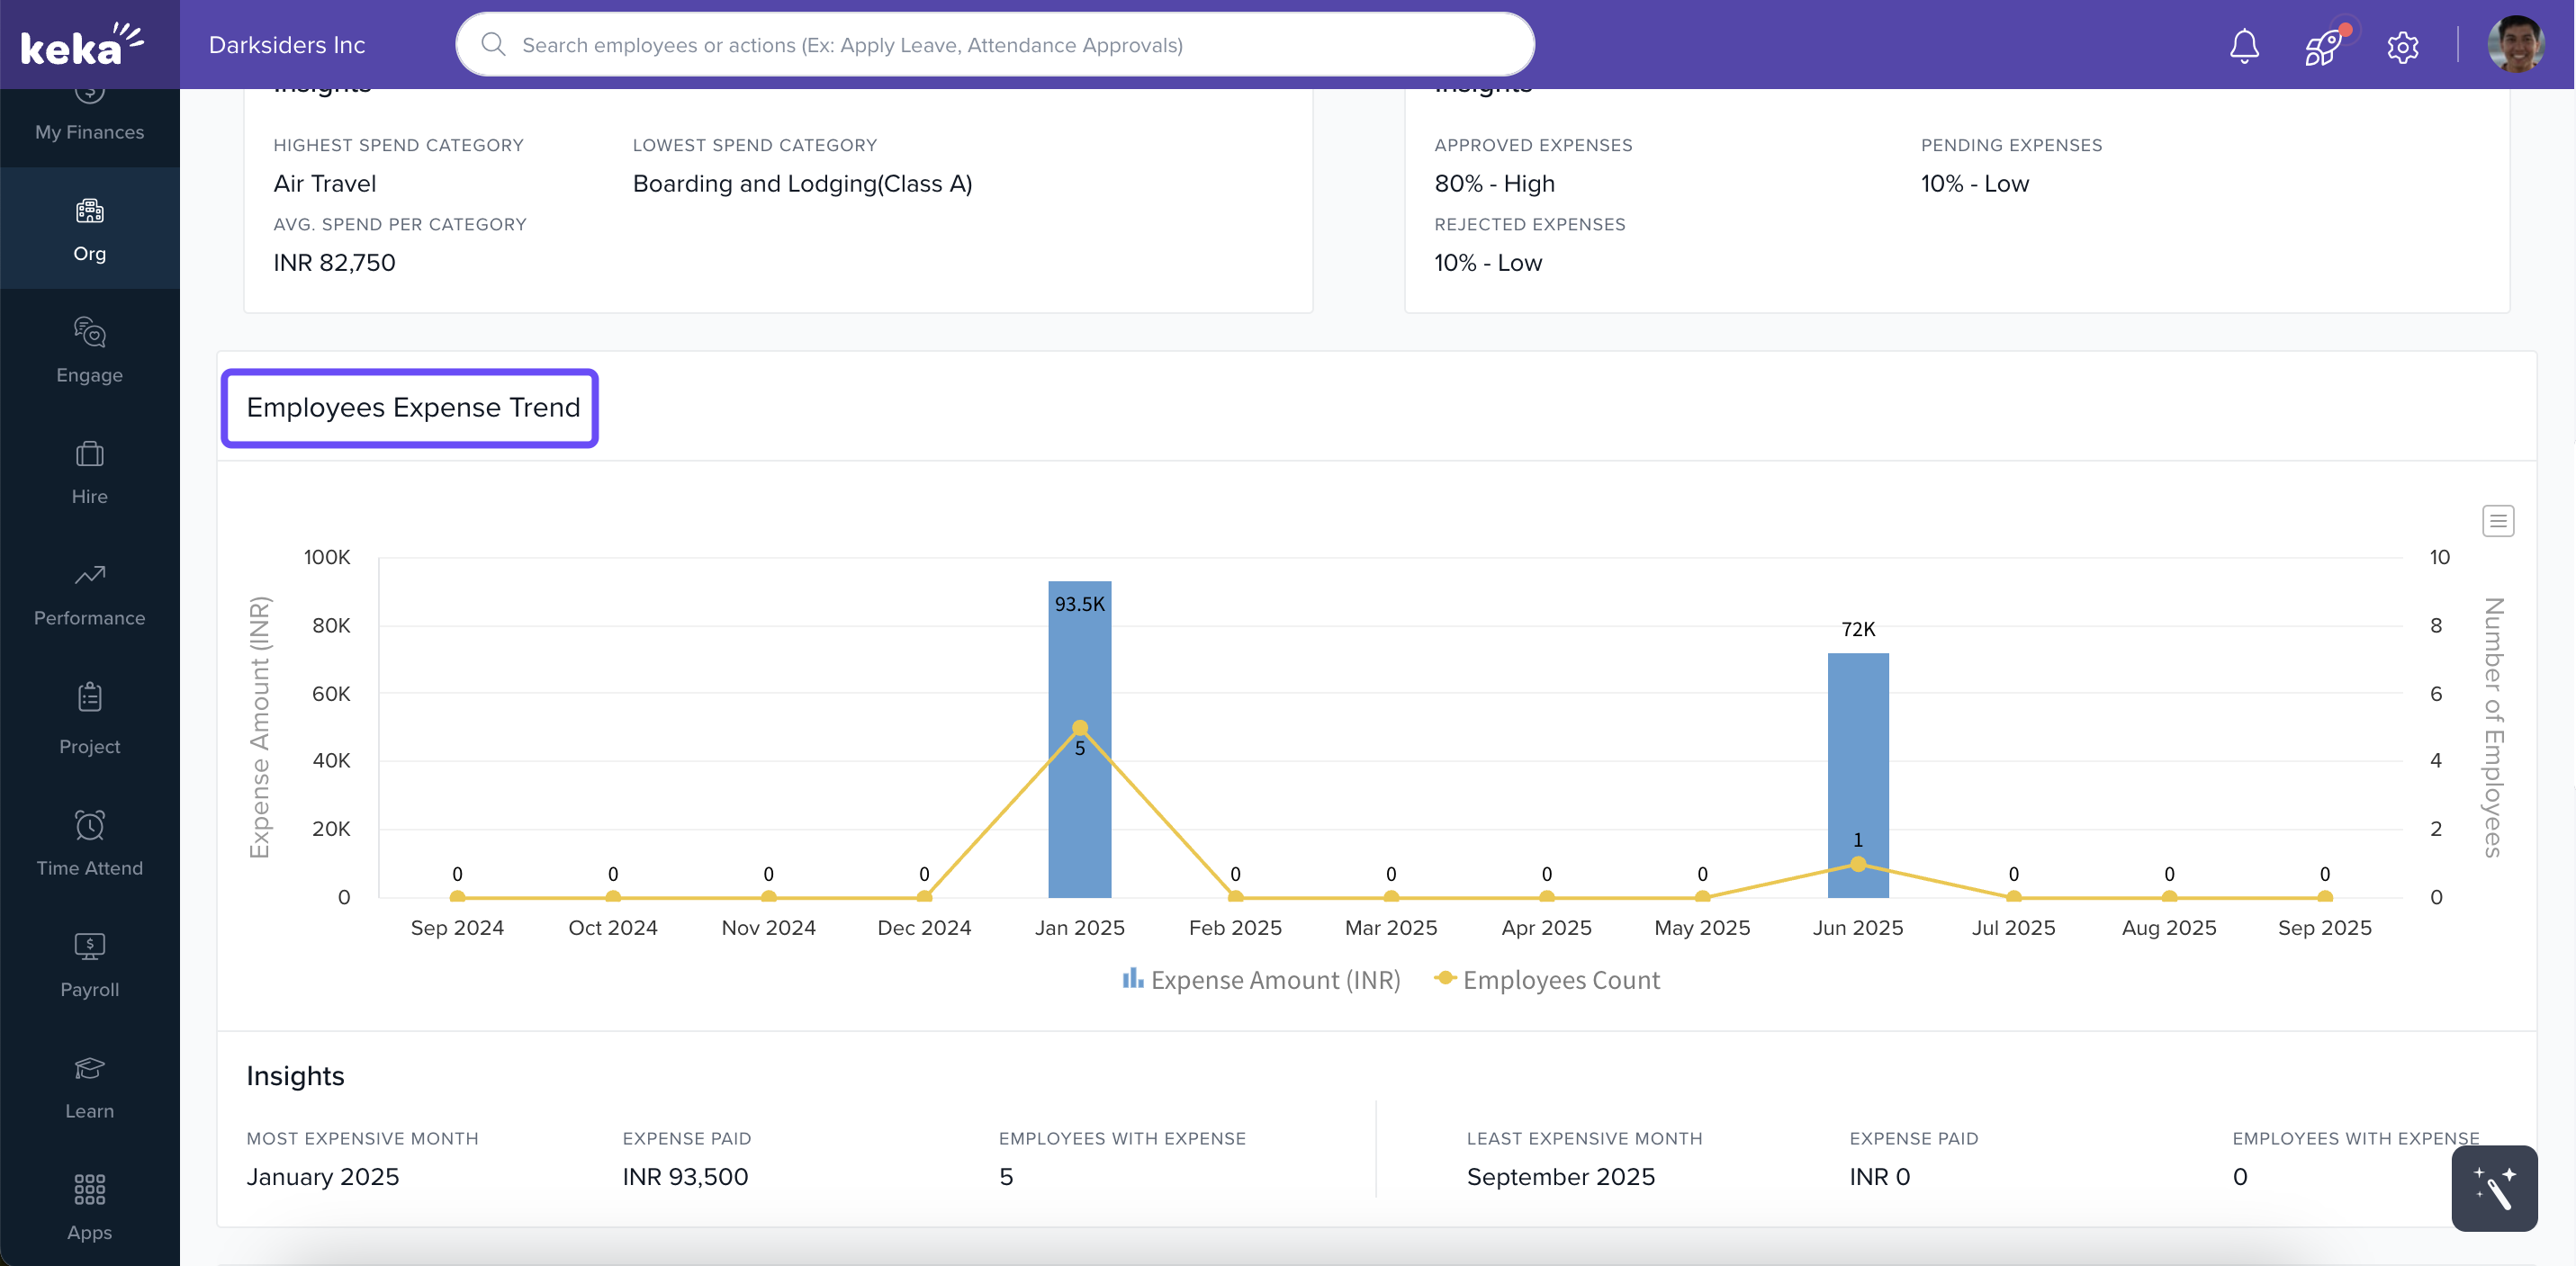
Employee Expense Trend graph shows month-by-month data on claim volume and amounts
-
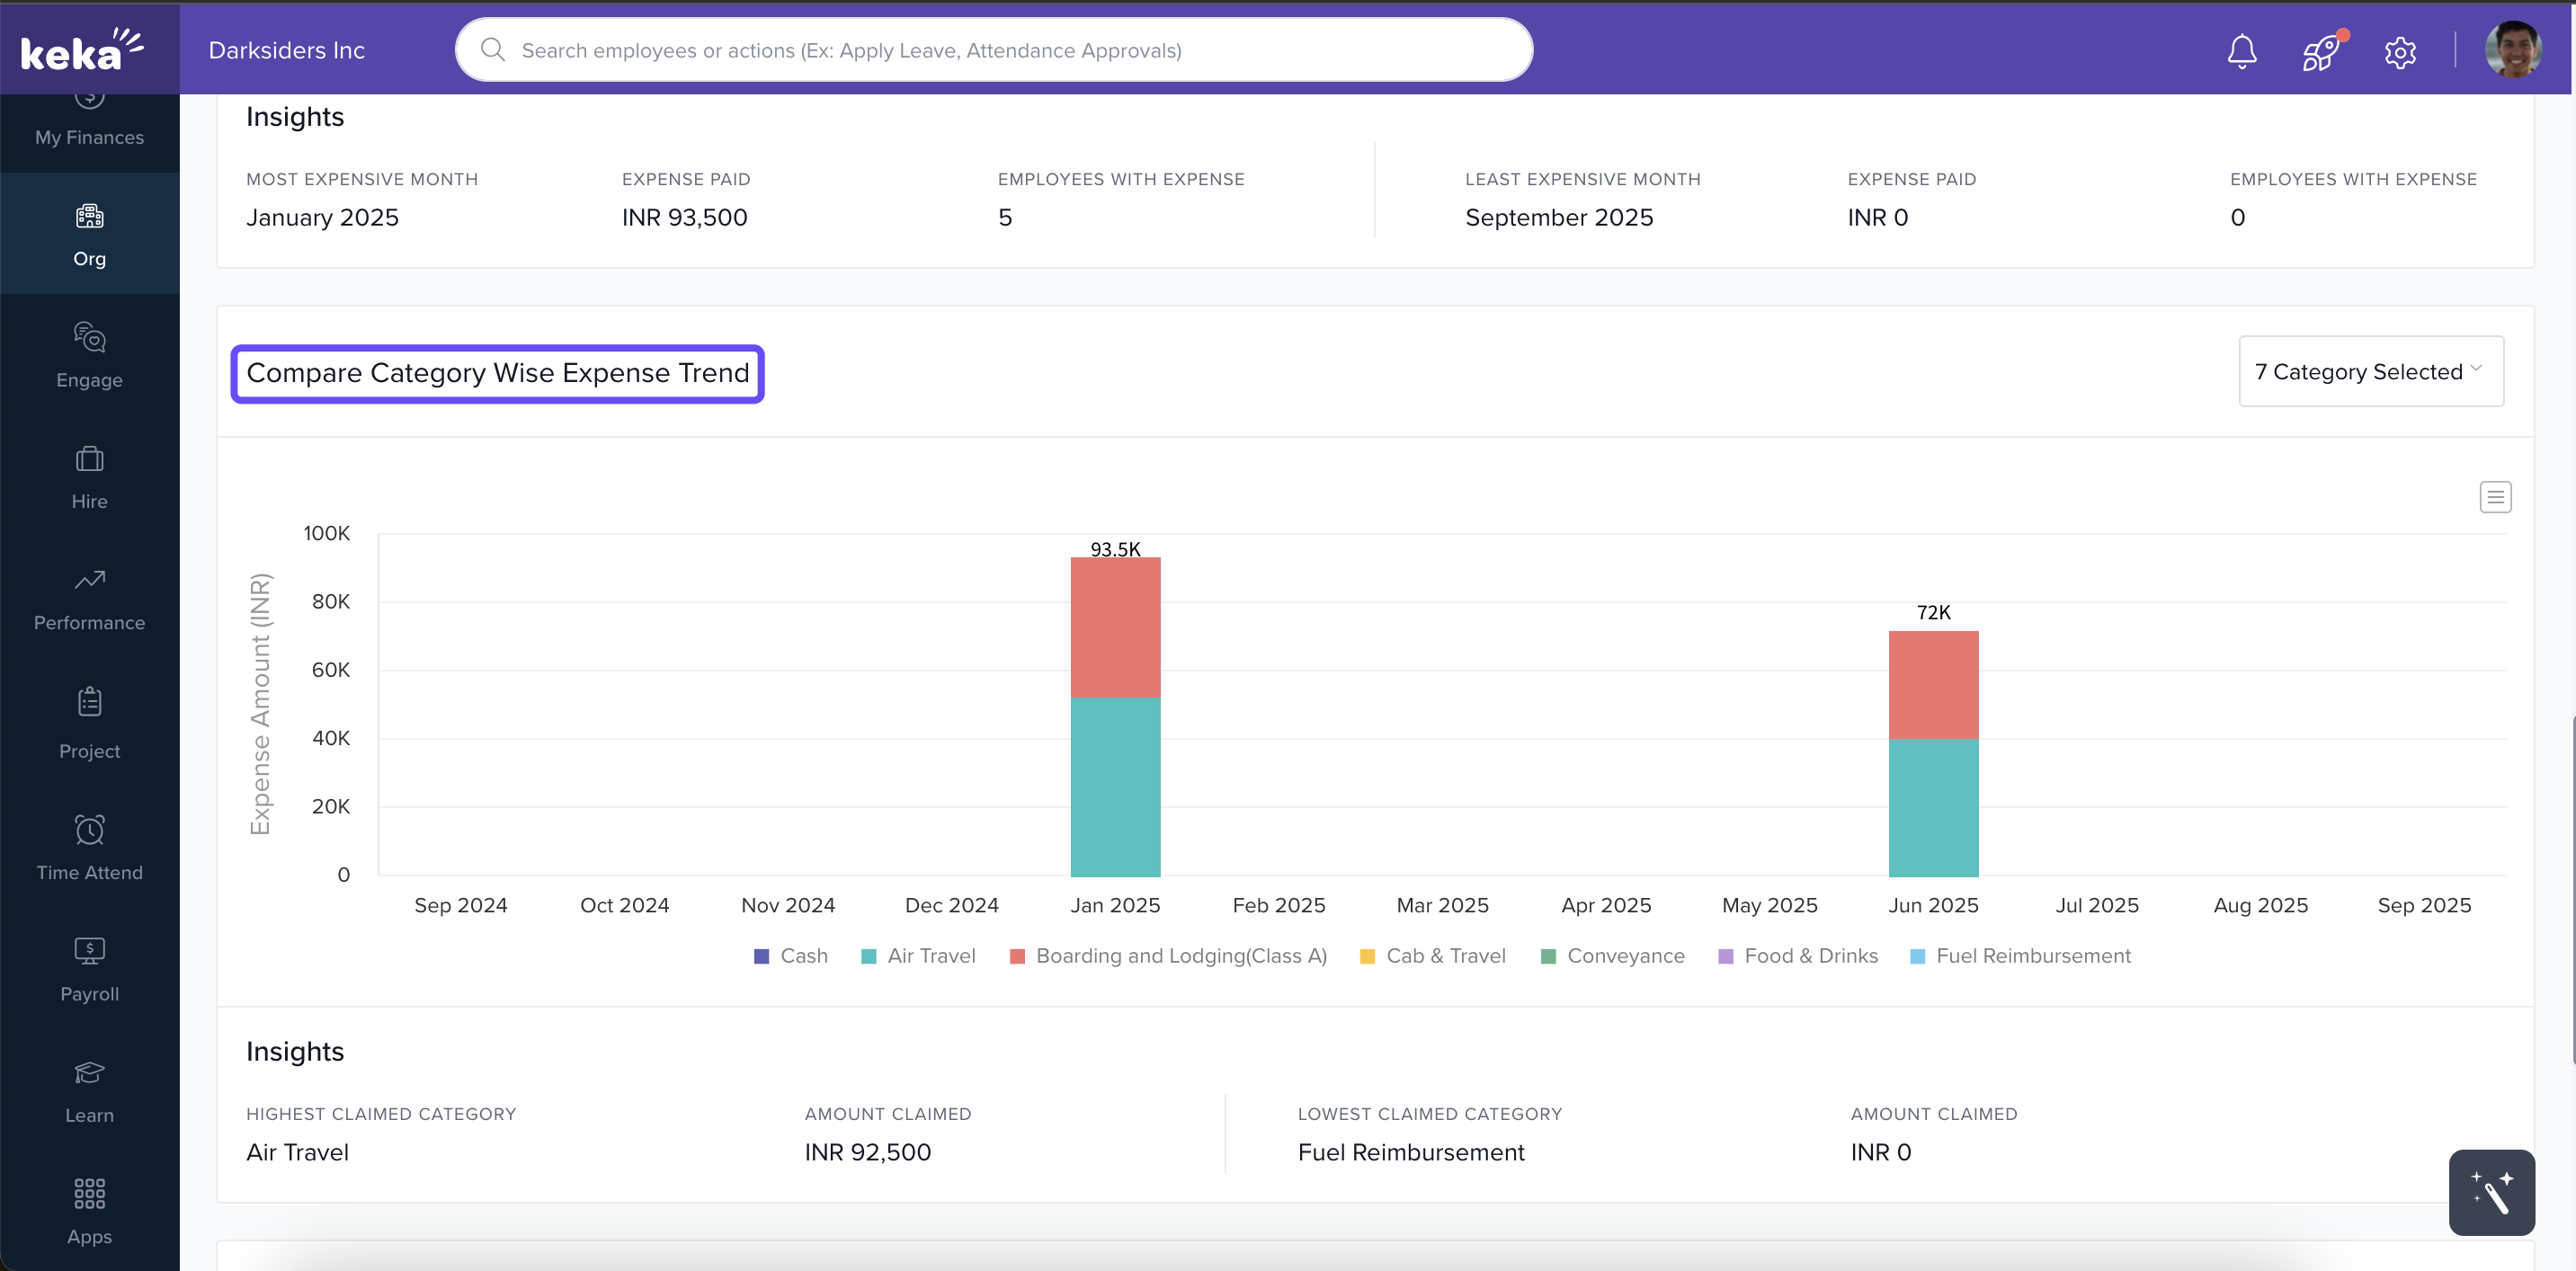
Compare Category‑Wise Expense Trend lets you compare expense categories over time—pick categories manually and see insights below the chart
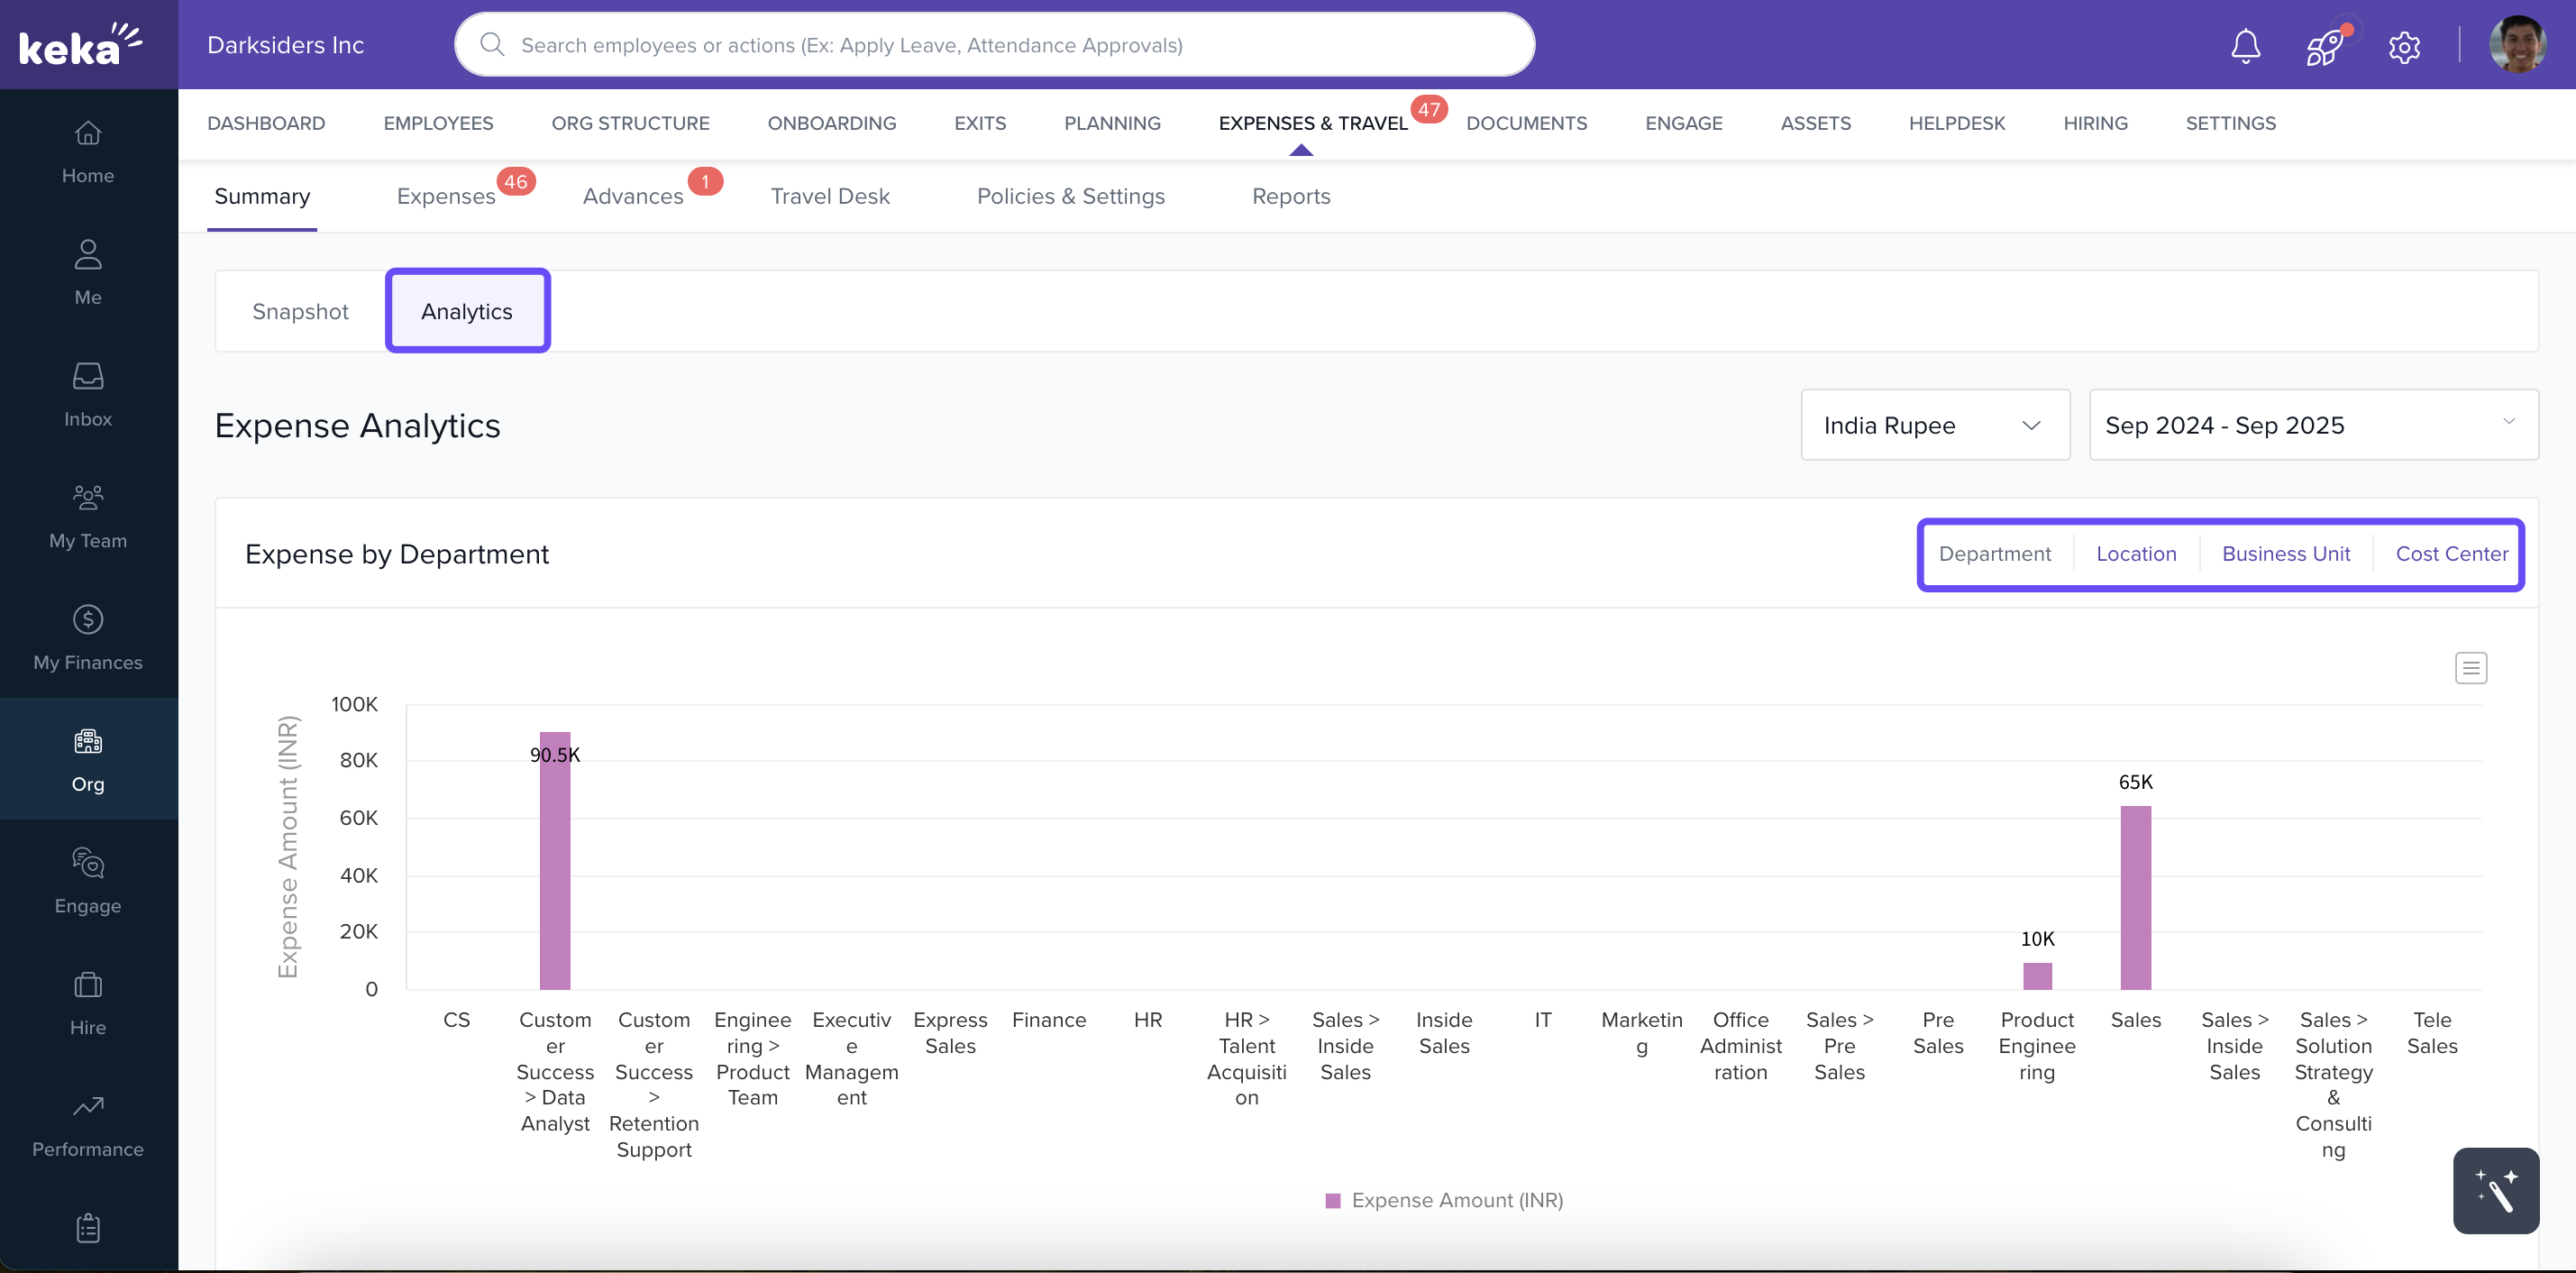
3. Analytics Tab — Drill Deeper
Switch to the Analytics tab for detailed analysis:
-
Filter expenses by Business Unit, Department, Location, or Cost Center.
-
View results in customizable Expense Analytics graphs to pinpoint trends across specific segments
4. Exporting Analytics.
Keka’s Expenses & Travel Dashboard gives you more than just numbers—it empowers your finance and HR teams to visualize spend patterns, catch inefficiencies early, and make better budgeting decisions. Whether you're tracking high-level trends or drilling into department-level expenses, the Snapshot and Analytics tabs help turn raw data into actionable insights.
Use this dashboard regularly to stay on top of expense claims, identify outliers, and ensure every rupee or dollar is accounted for.
Comments
0 comments
Please sign in to leave a comment.