Introduction
Keka’s Pulse module helps you monitor employee sentiment with ease. With real-time analytics across engagement scores and individual question responses, you can gain clear insights into how your people feel—by department, team, or organisation-wide.
This article walks you through how to interpret Pulse data and use these insights to improve engagement and workplace culture.
Please be aware that pulse data is collected only when three or more employees respond to the questions included in the pulse survey.
Navigate Pulse Tabs
Pulse data is split into two main tabs for simple analysis:
Engagement Score – Shows overall engagement metrics in graphs and heat maps.
Question Results – Displays individual question responses with detailed percentages.
Let’s look at each tab in detail.
Engagement Score
This tab provides a high-level view of employee engagement and survey participation.
Use Filters
Apply filters at the top of the screen to view data by:
Department
Business Unit
Location
Gender
Worker Type
Age
-
Quarter
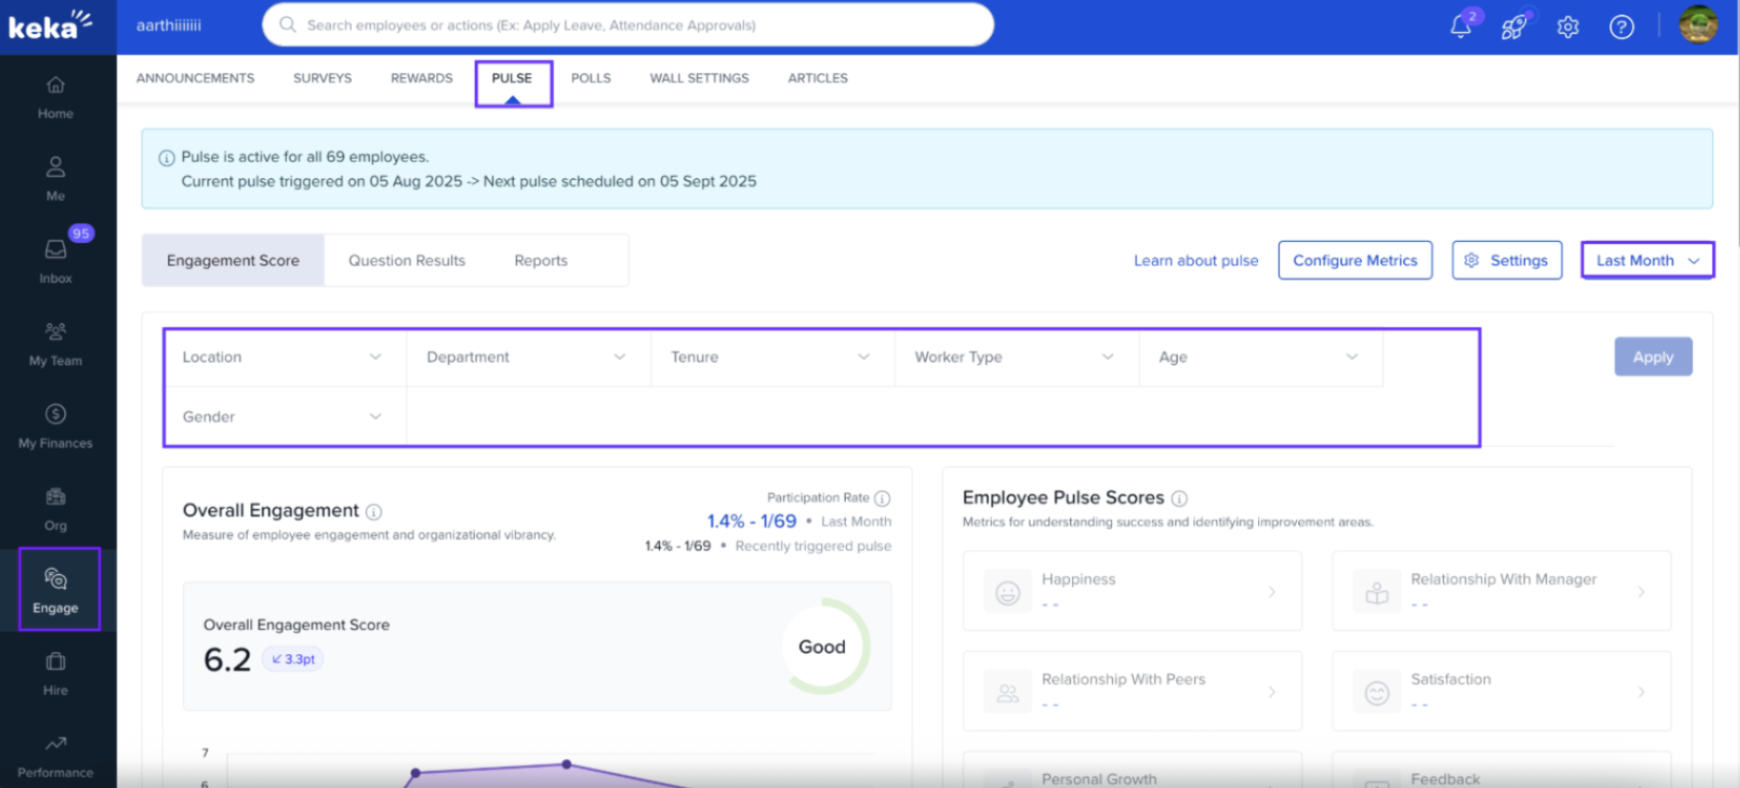
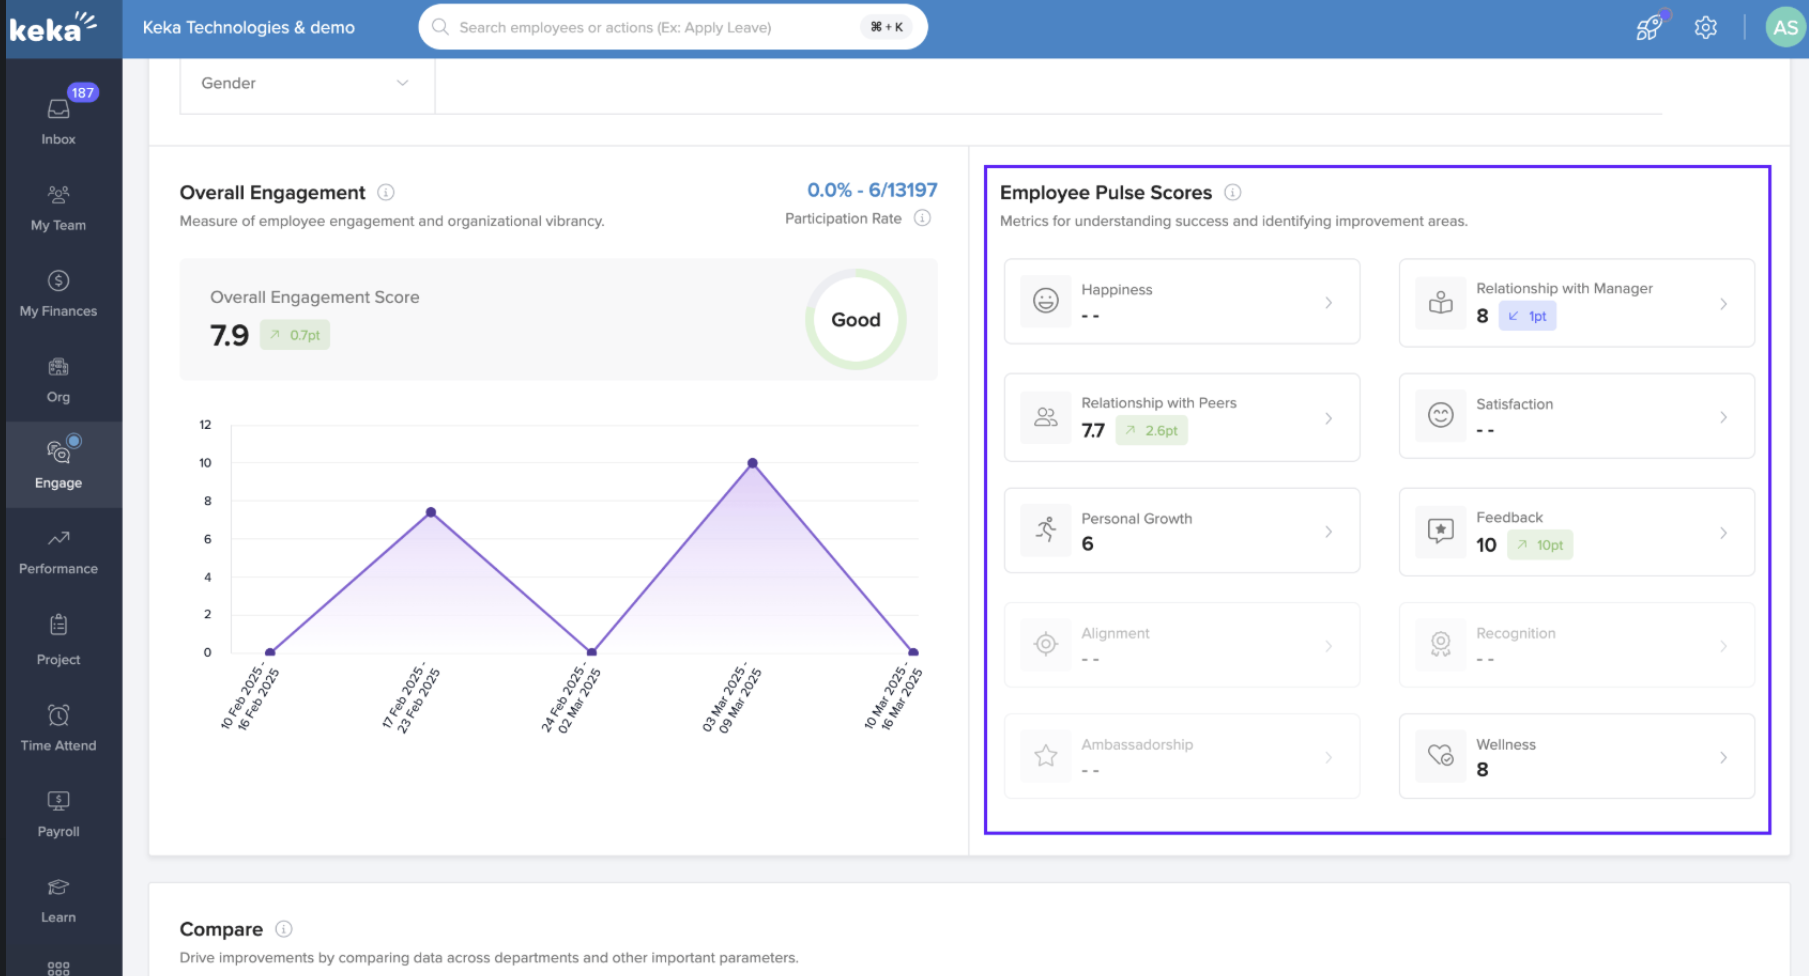
Overall Engagement
View a graph showing the average engagement score across all metrics:
< 3 – Poor
3–6 – Average
> 6 – Good
2. Next to the graph, you’ll see key stats:
Engagement Score
Participation Rate
-
Overall Rating
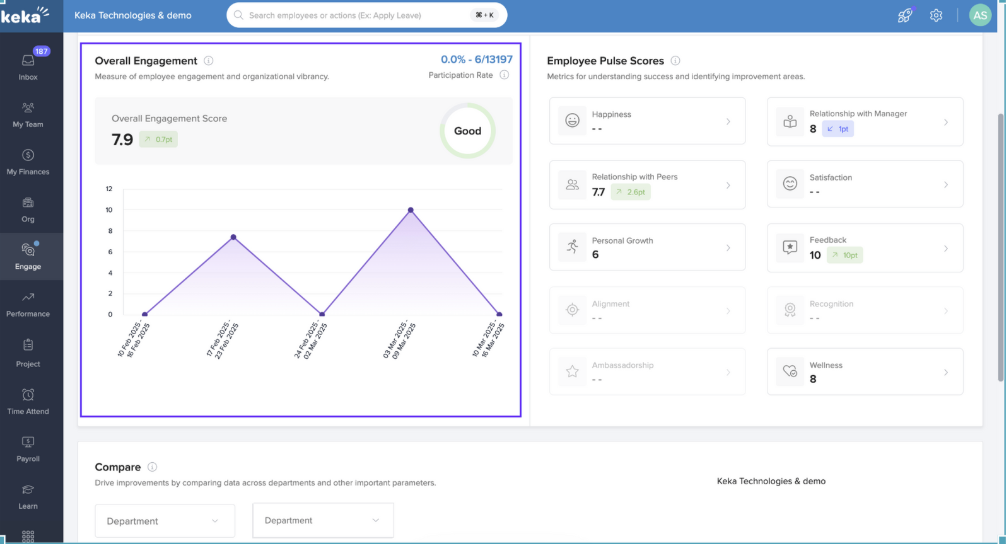
This section gives you a quick snapshot of how engaged your employees are.
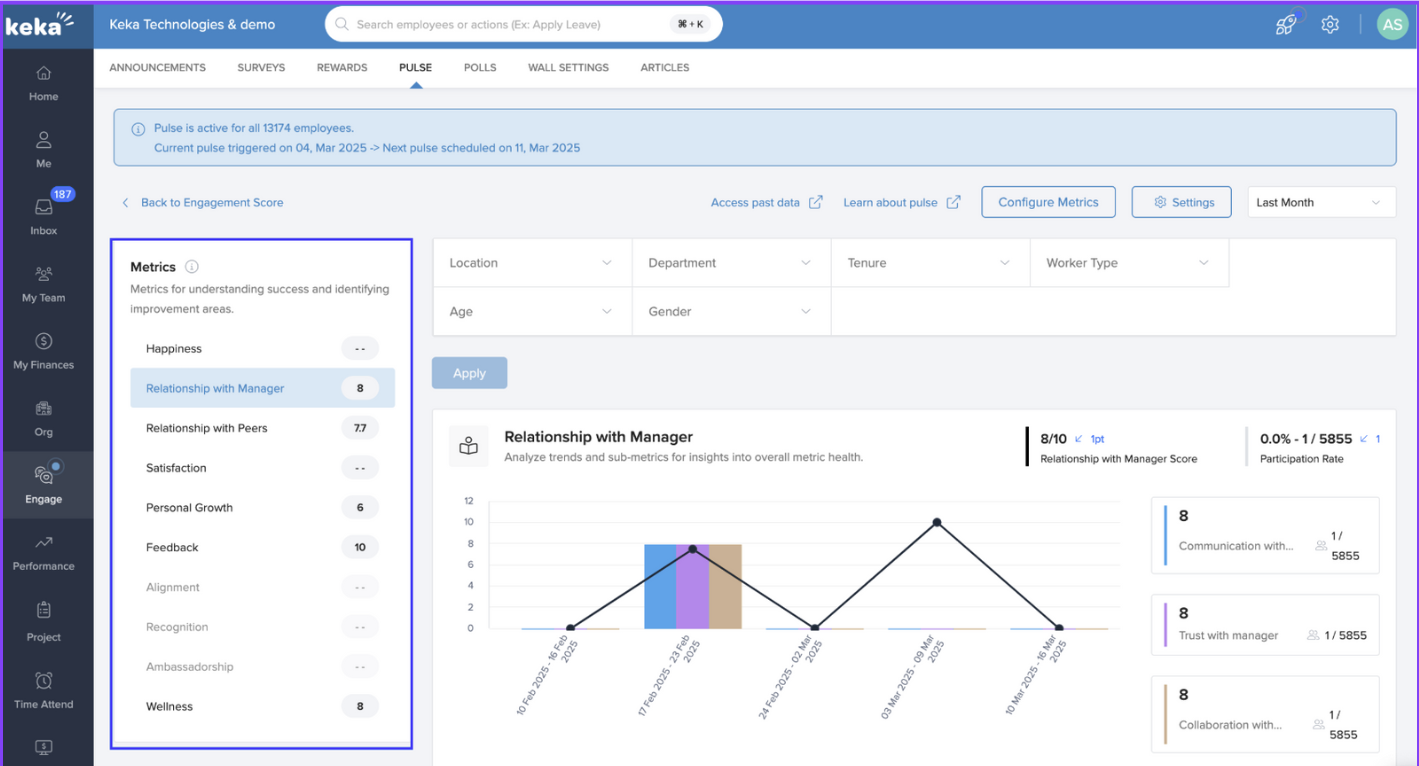
Employee Pulse Score
This section breaks down scores across various engagement metrics (like happiness, relationship with manager, etc.).
Each metric includes a rating and trend (increase or decrease).
-
Click a metric to view:
A detailed graph of scores over time
The specific questions used for that metric
How scores are calculated:
Metric Score = Weighted average of sub-metrics
-
Sub-metric Score = Total of all respondent scores ÷ number of responses
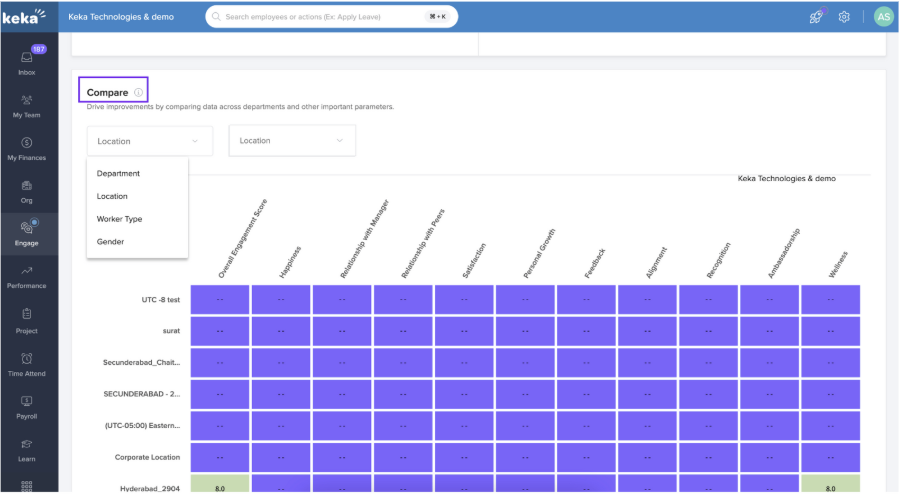
Compare (Heat Map View)
- At the bottom, the Compare widget uses a heat map to show how different groups (e.g., departments or locations) score across engagement metrics.
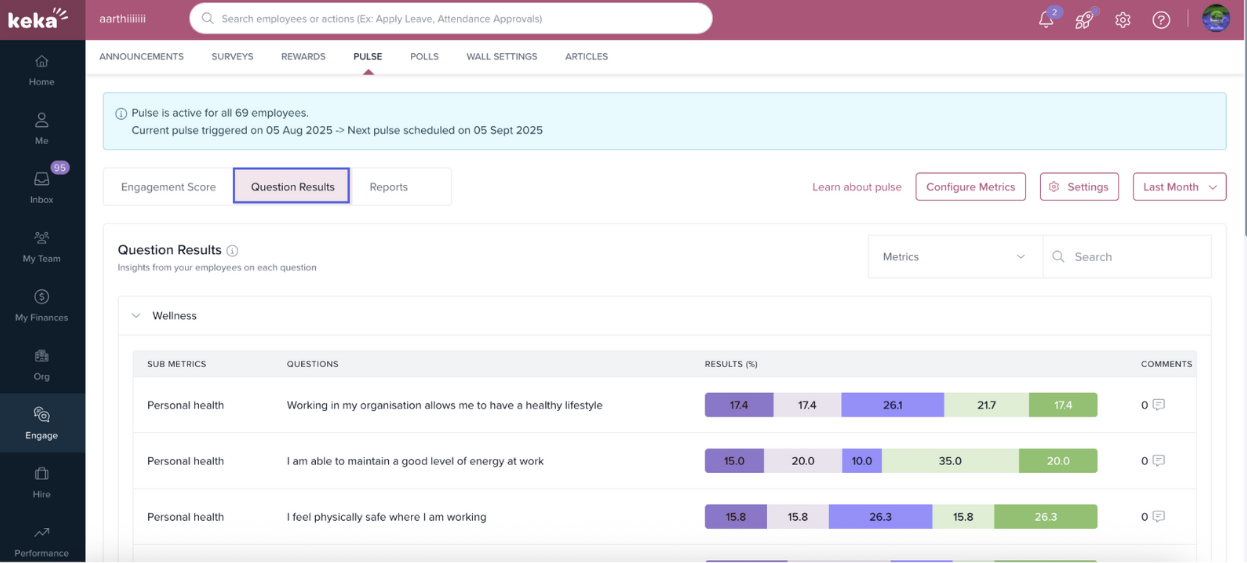
Question Results
This tab shows how employees responded to each survey question.
Use the search bar to filter responses by metric or keyword.
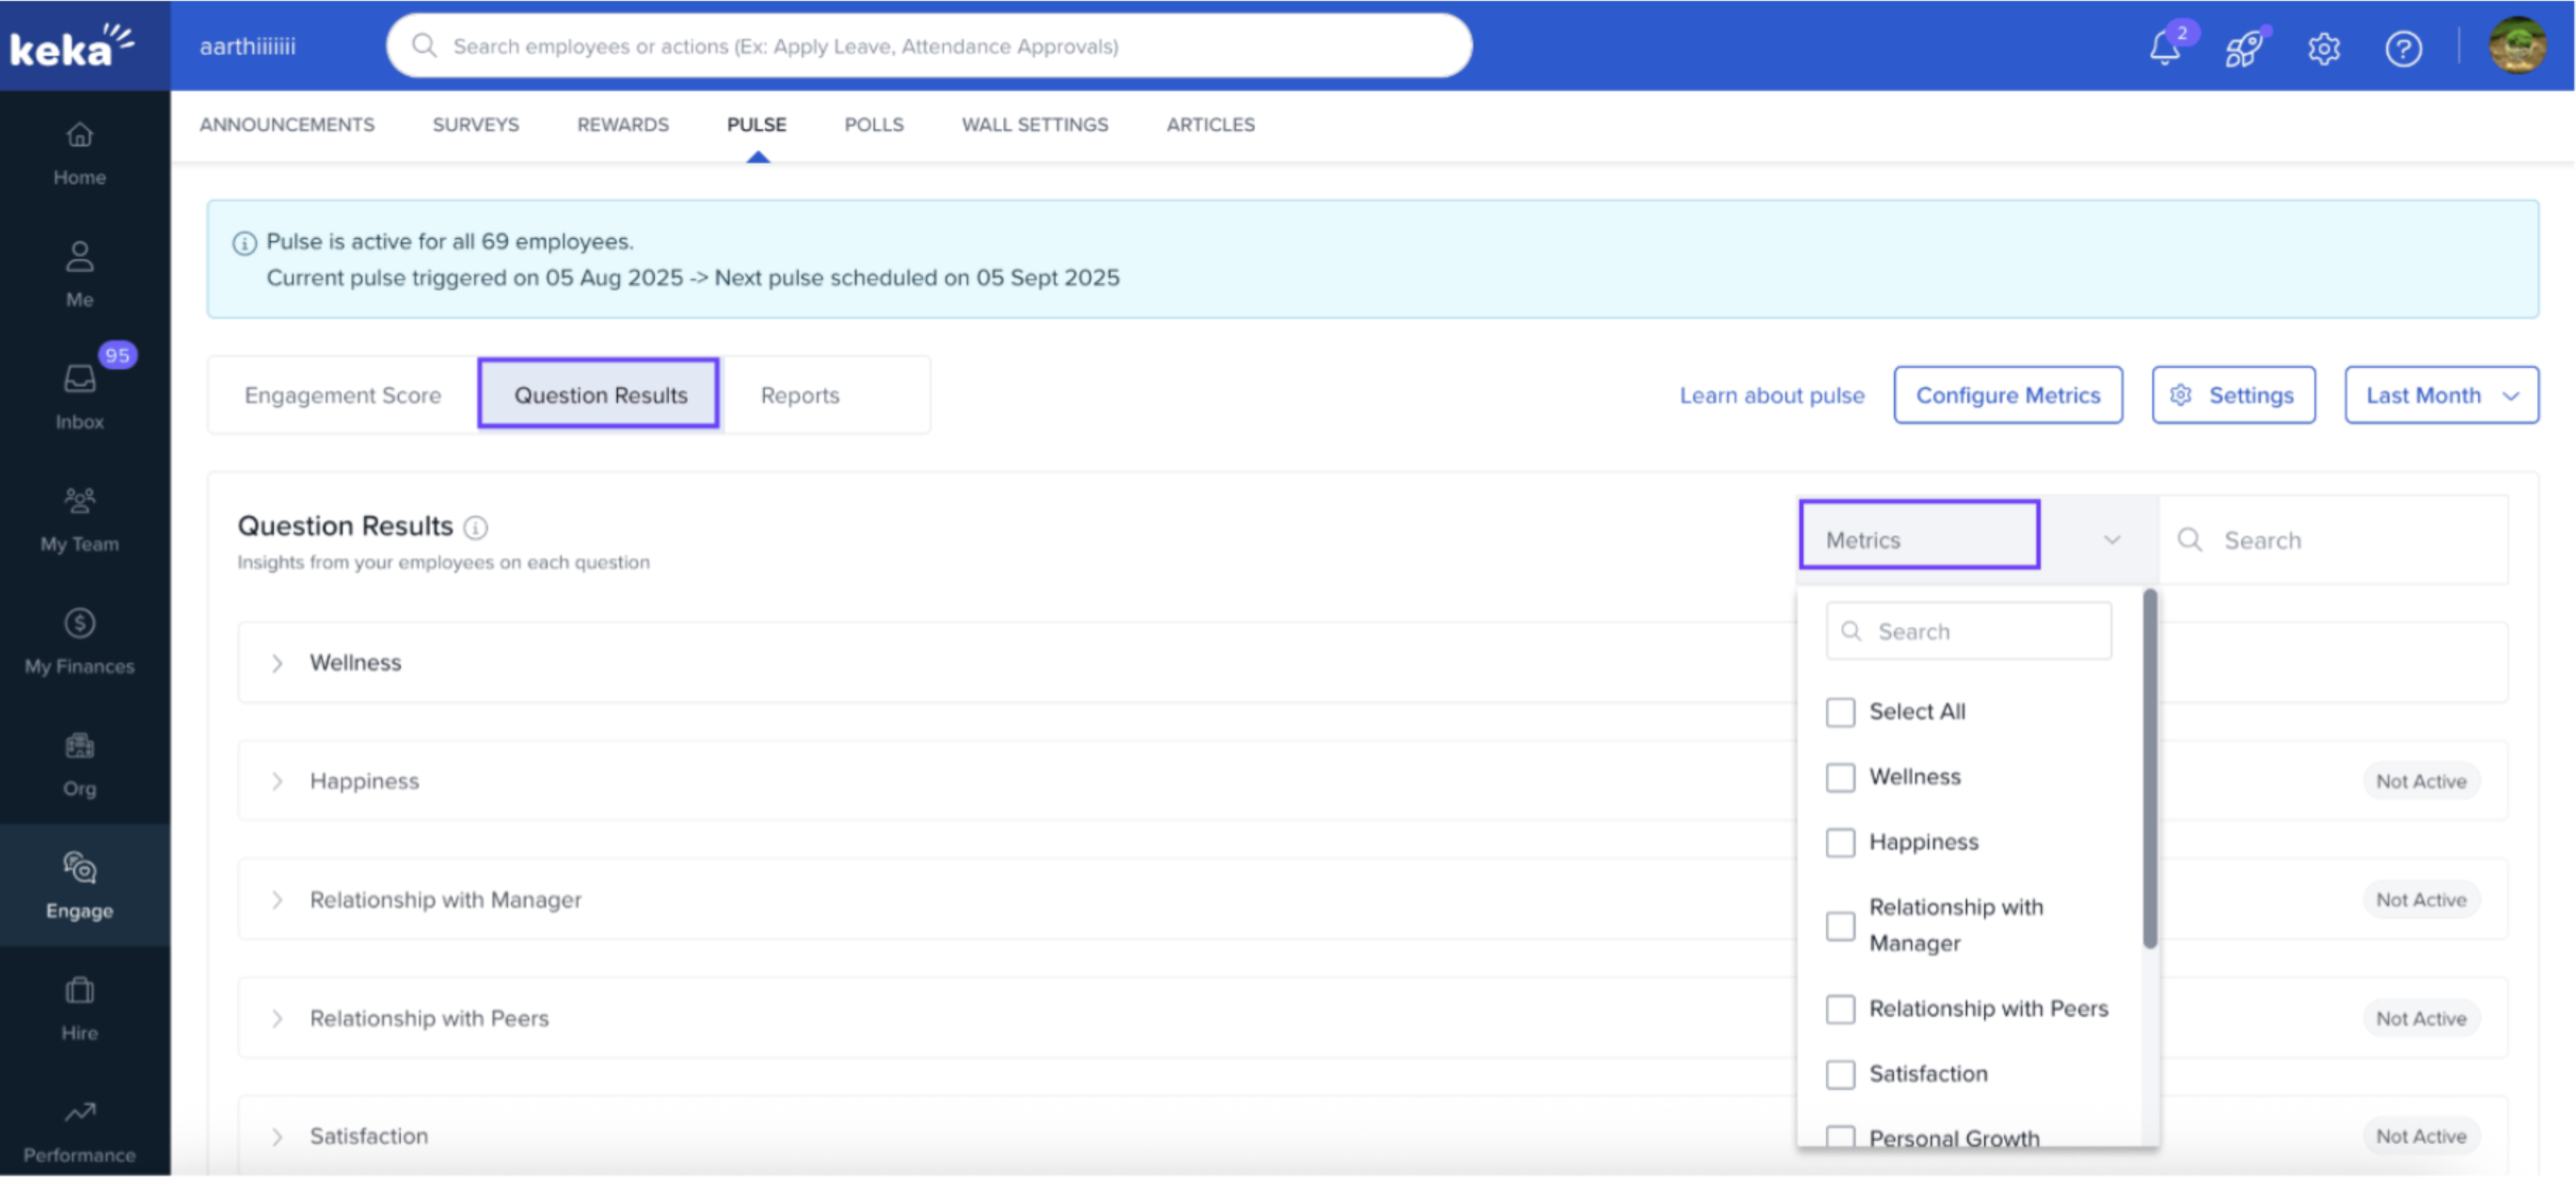
2. Results are shown in percentage format, based on the number of employees who selected each option out of total responses for that question.
This view is especially useful for identifying trends in specific areas.
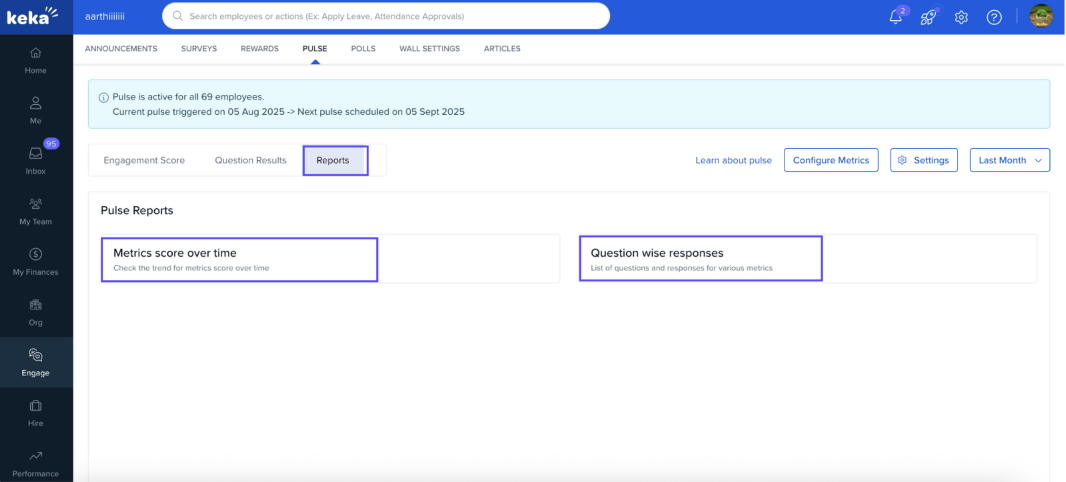
Reports
- Go to the Reports section in the Pulse module to download two types of reports:
-
Under Reports tab under Pulse. You’ll find two options:
Metrics score over time
Question wise responses
View Metrics Score Over Time
Click Metrics Score Over Time.
Select a Date Range.
-
Click Run.
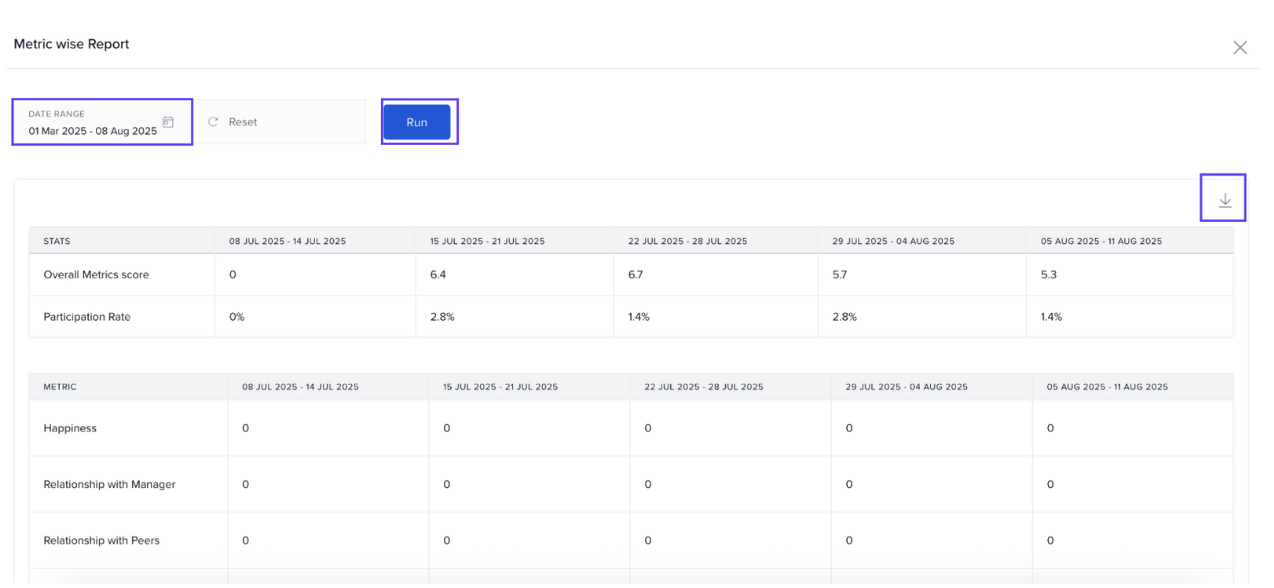
You’ll see:
Overall Engagement Score
Participation Rate
Trends for key metrics like Happiness or Manager Relationships
Click the Download icon to export the data.
View Question-wise Responses
Click Question-wise Responses.
Set a Date Range and select a Metric.
-
Click Run.
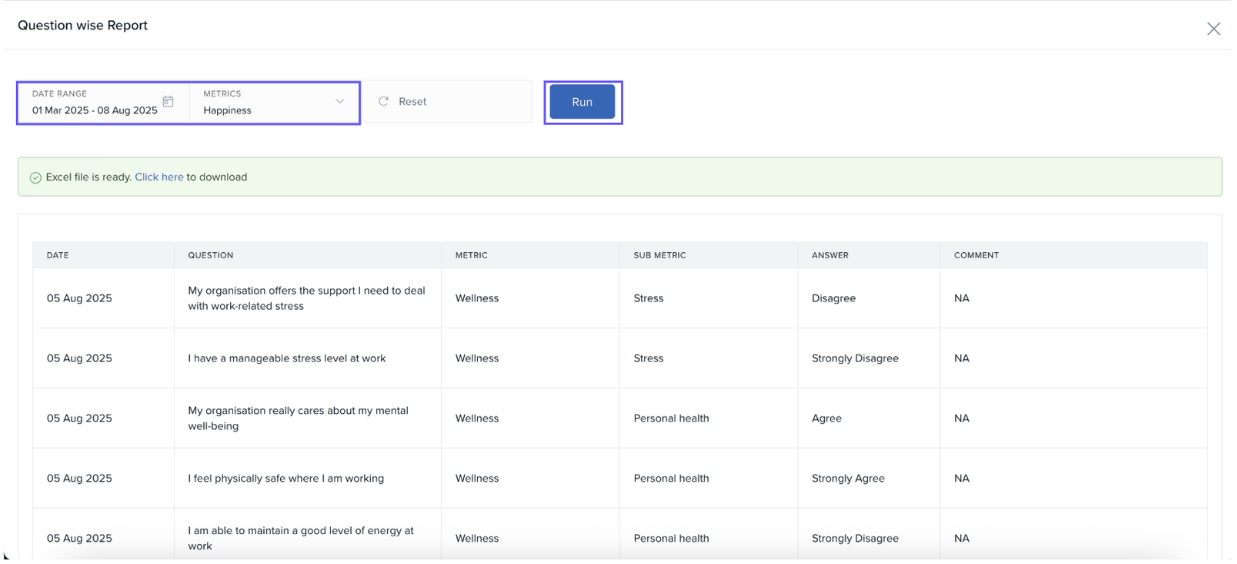
The report will show:
Date
Question
Metric and Sub-metric
Employee Responses
Any Comments
4. Click Download to export the results as an Excel file.
Notes & Tips
- Tip: Use filters to zoom in on specific teams, departments, or demographics for targeted actions.
- Important: Calibrate metrics using trends to inform decisions on engagement initiatives.
- Note: All survey answers are anonymous and aggregated—individual responses are not visible.
Comments
0 comments
Please sign in to leave a comment.