Introduction
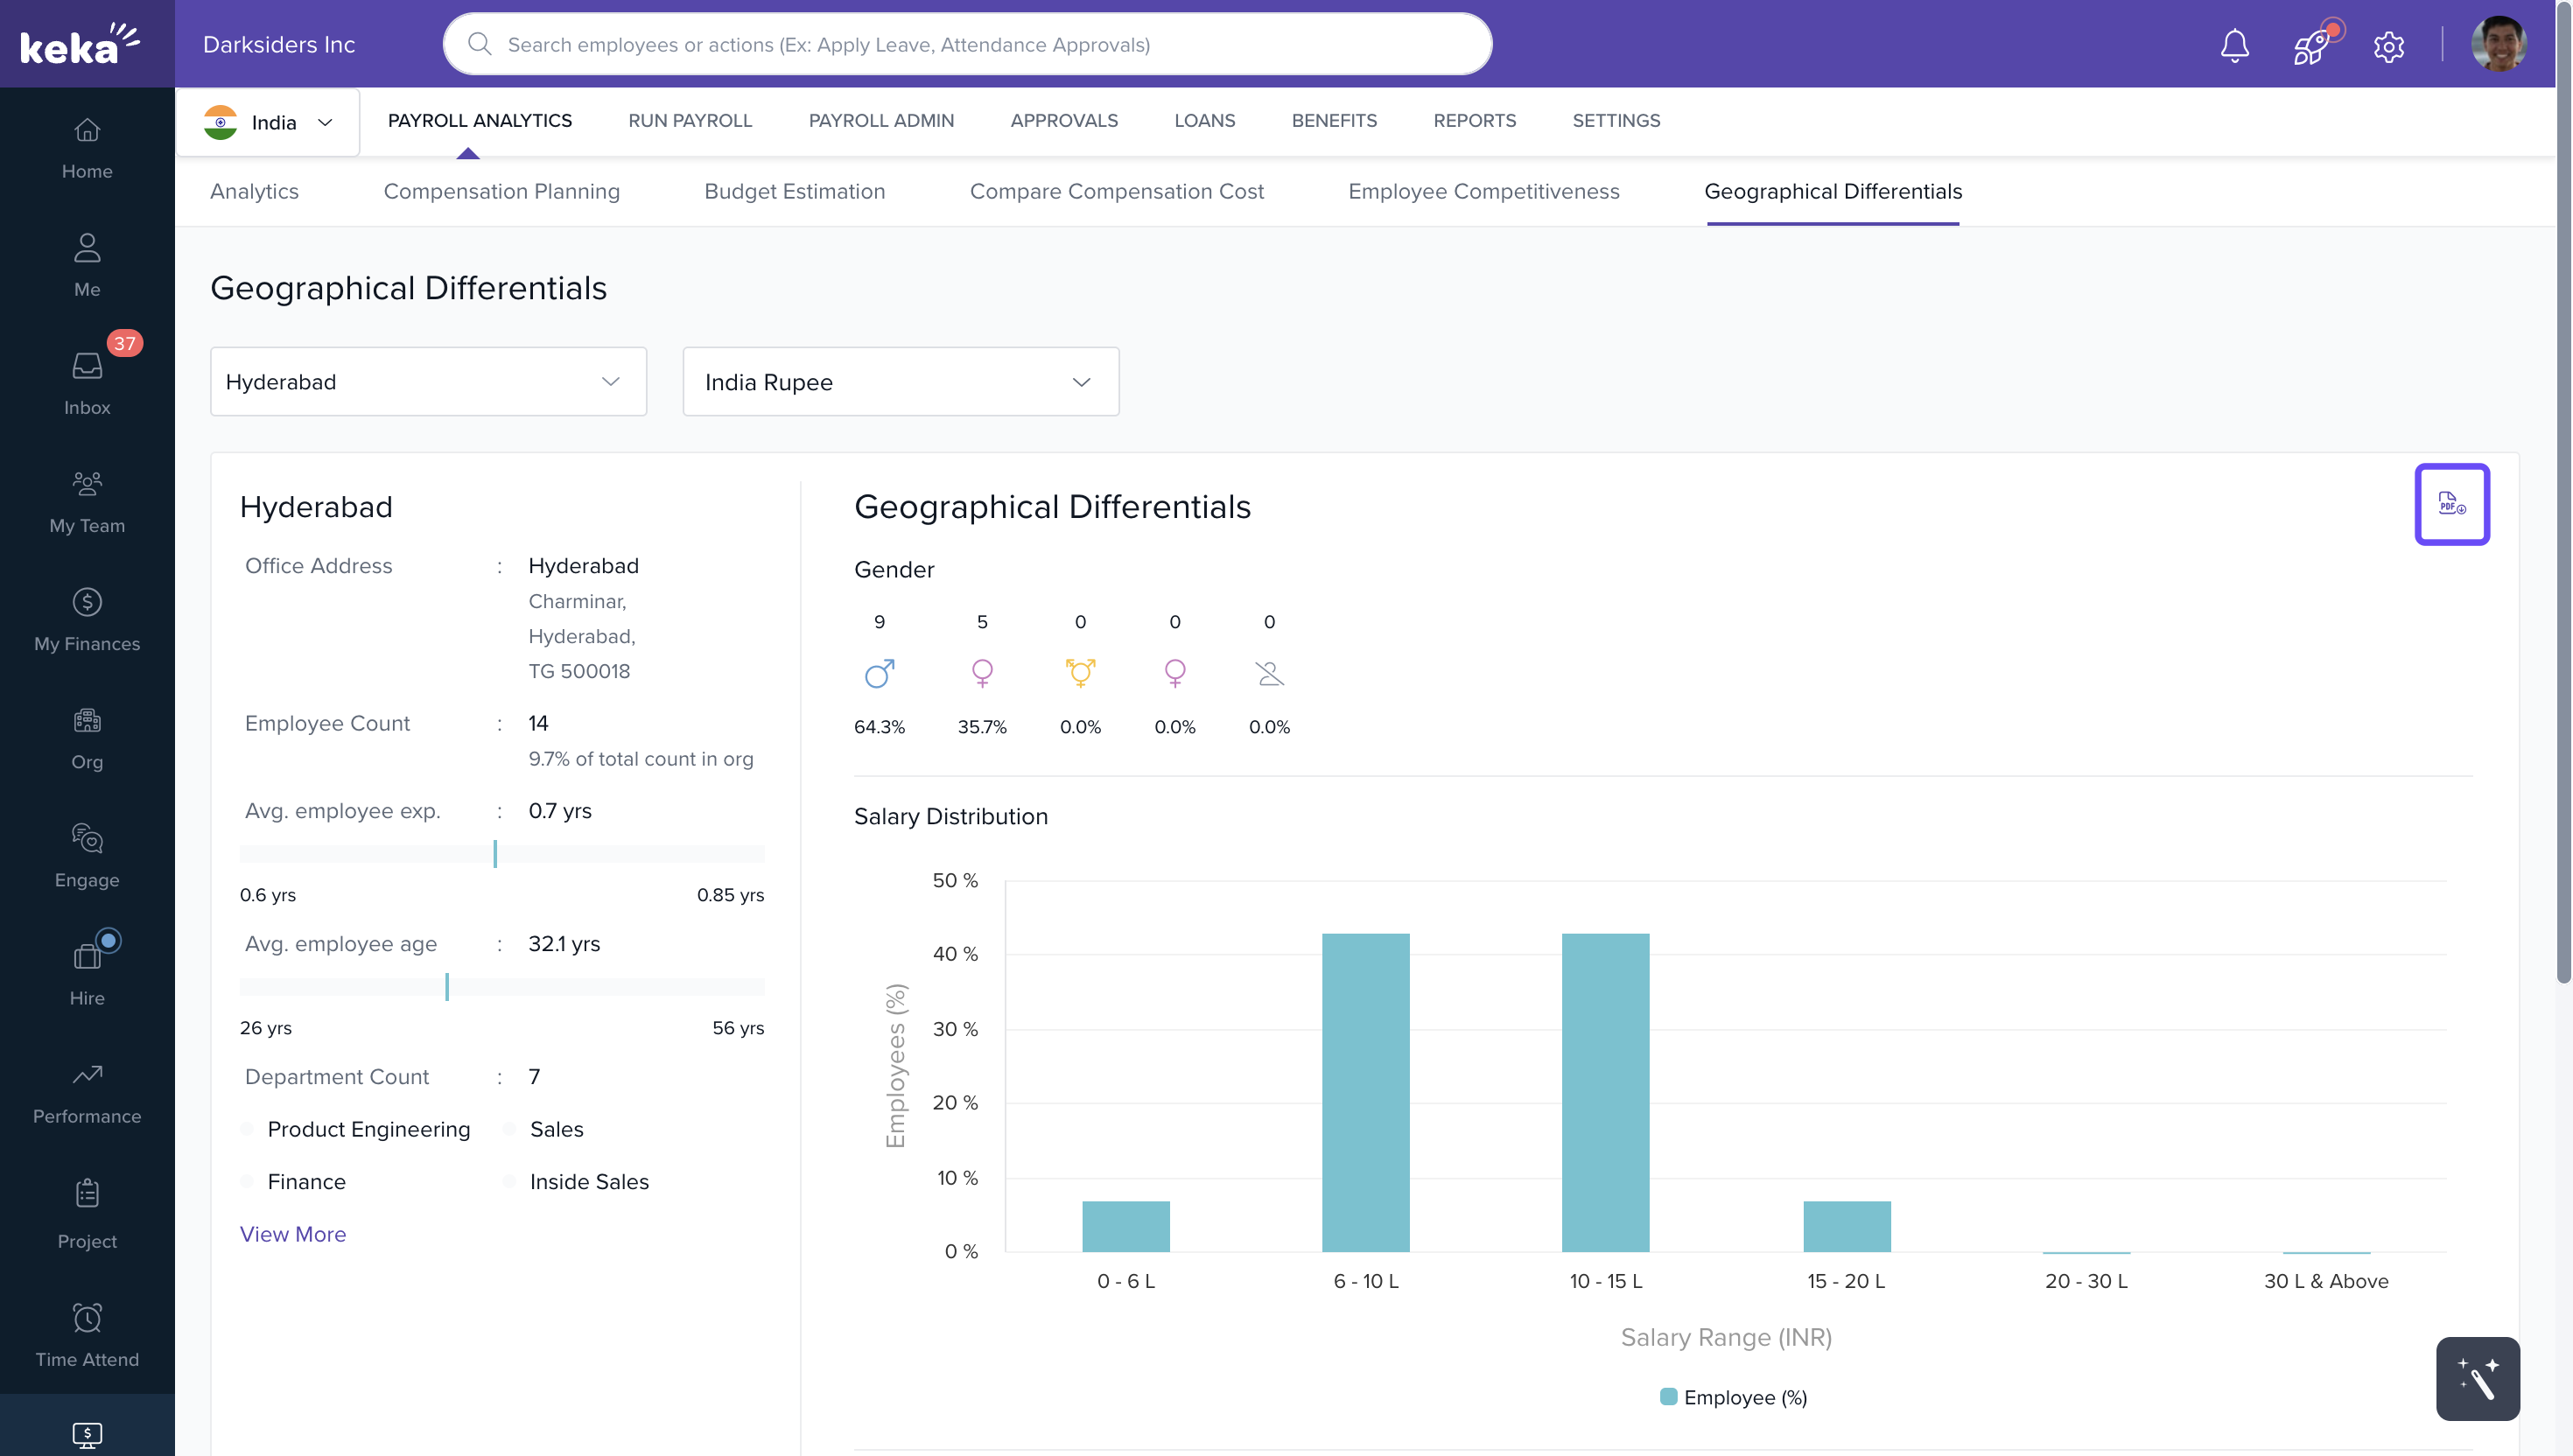
The Geographical Differentials tab in Keka’s Payroll Analytics helps you analyze employee and payroll data based on specific company locations. You can view salary distribution, gender data, employee experience, and departmental headcount for any configured location.
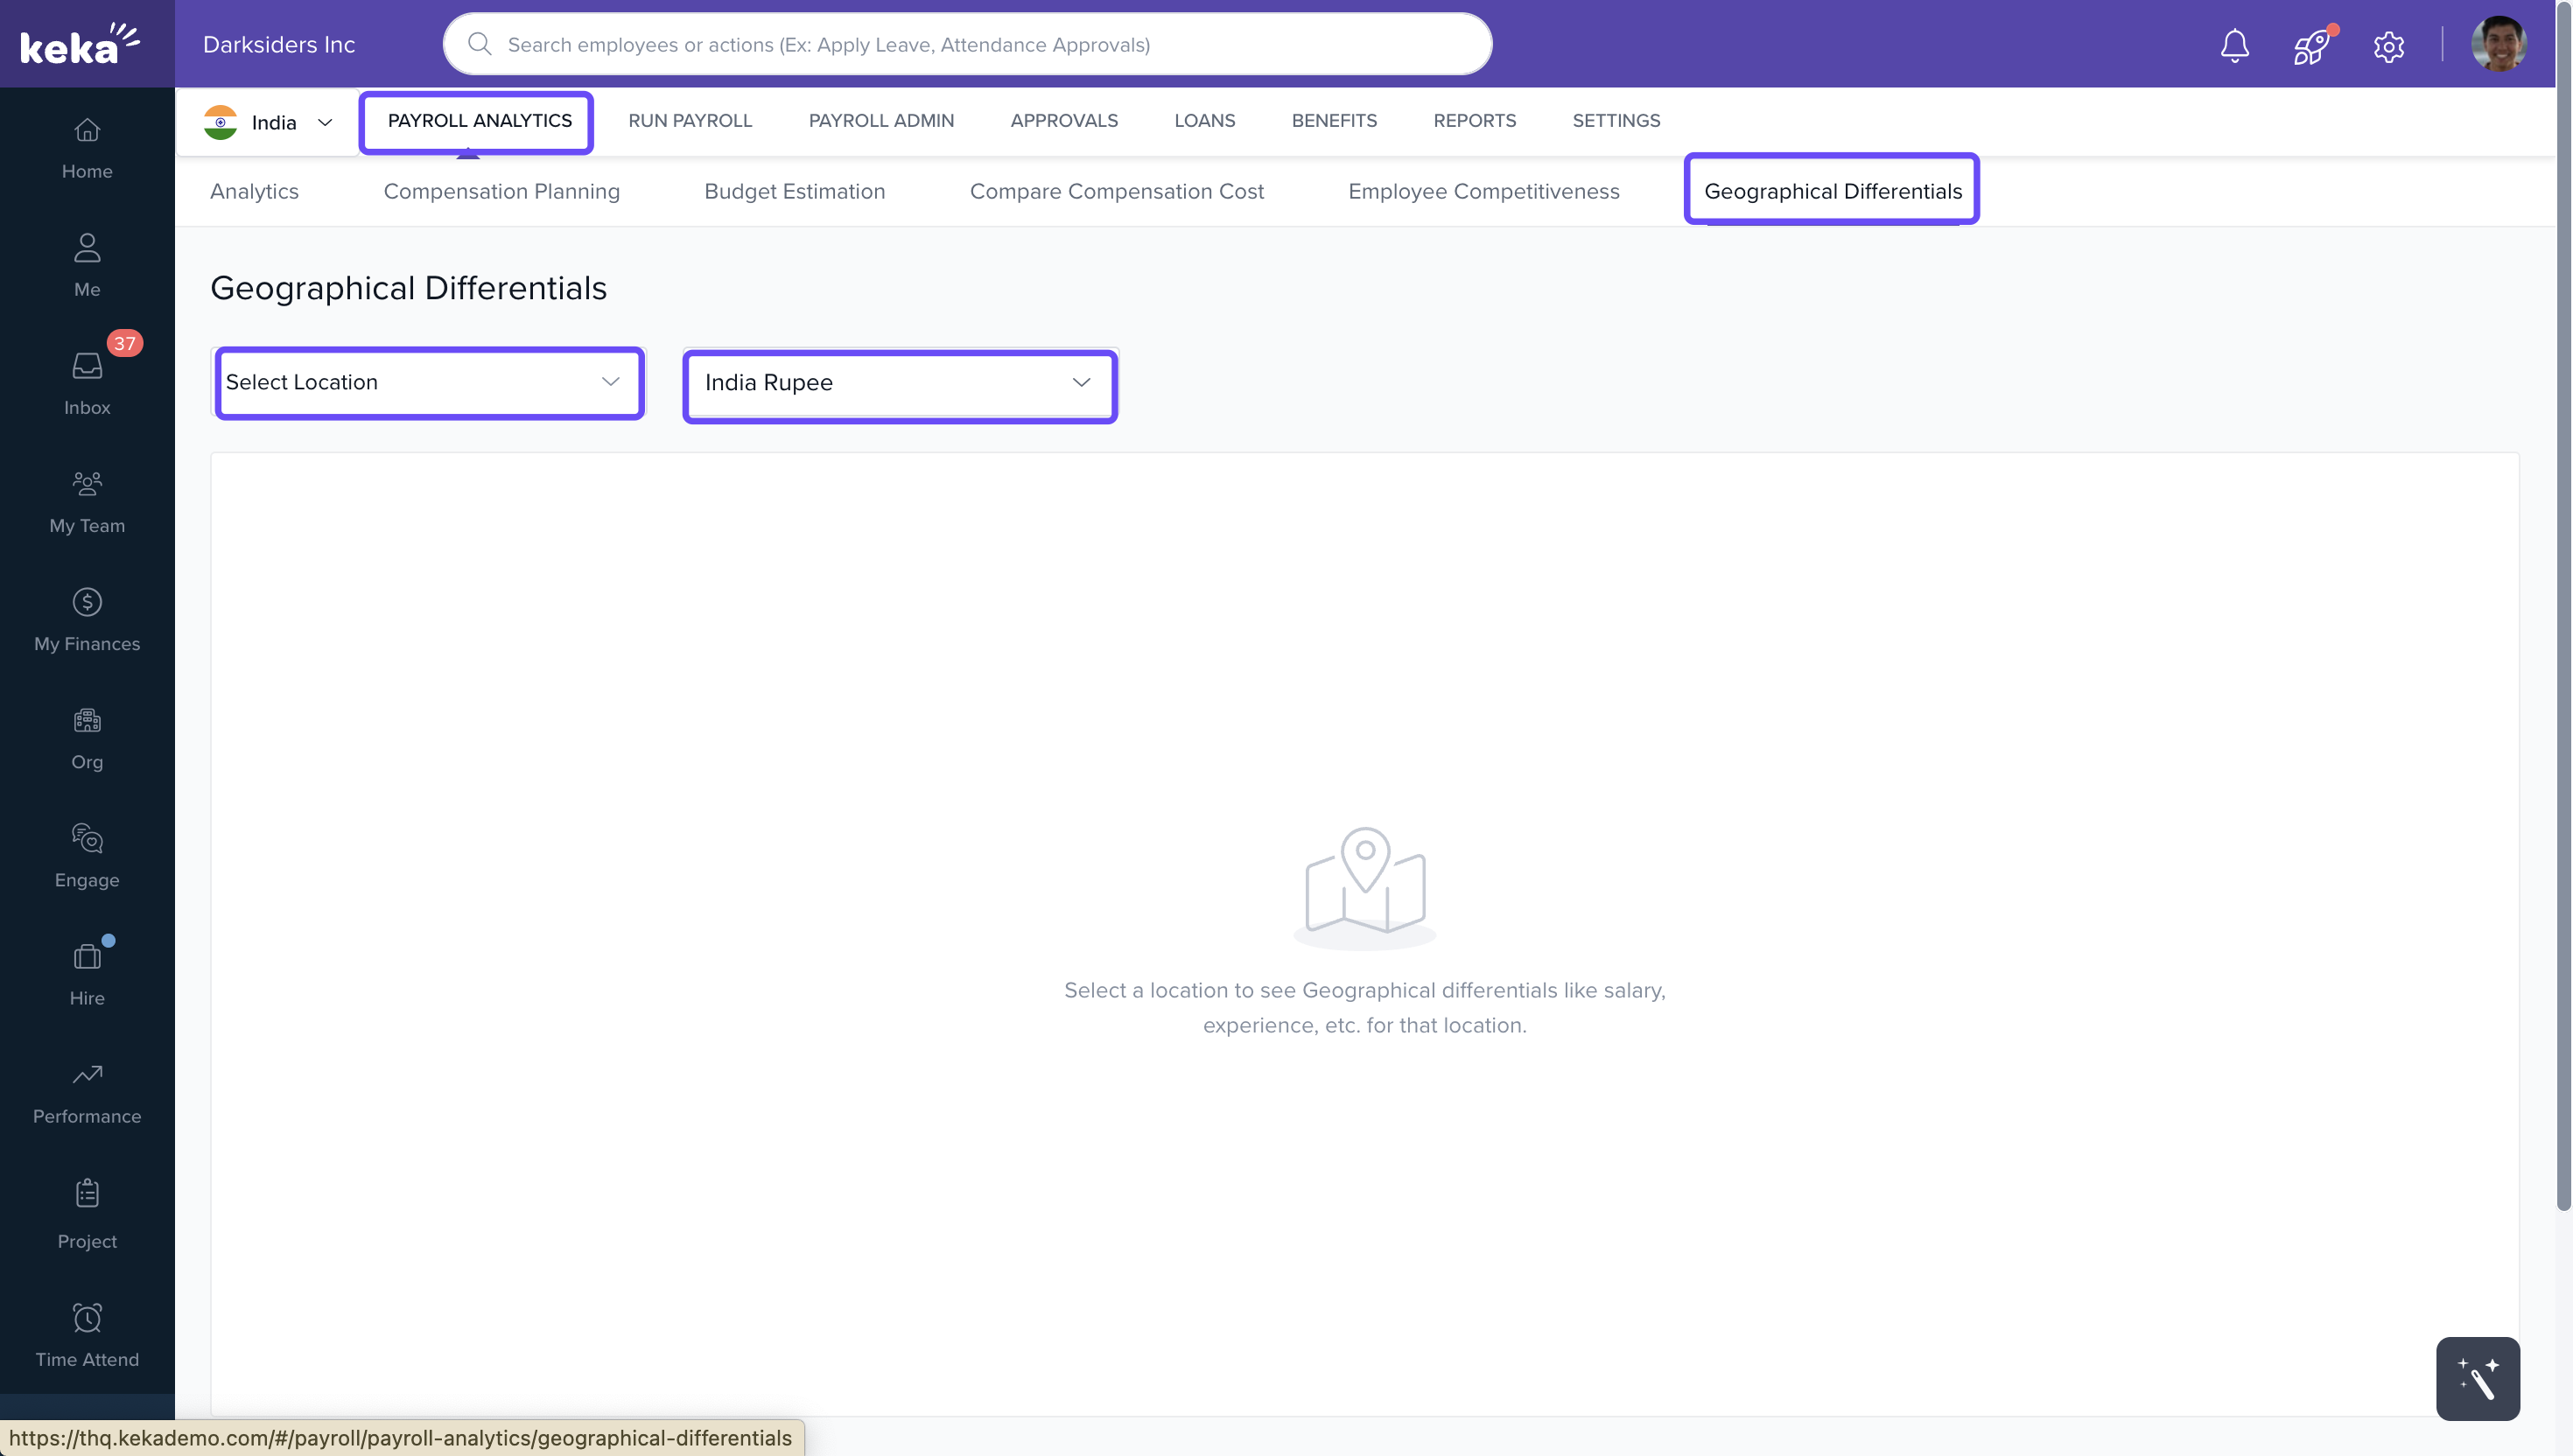
Access Location-Specific Data
1. Go to the Payroll Analytics tab.
2. Click the dropdown arrow next to the location name.
3. Select a location from the list.
4. Choose a currency from the dropdown (only currencies configured for your organization will appear).
Widgets-
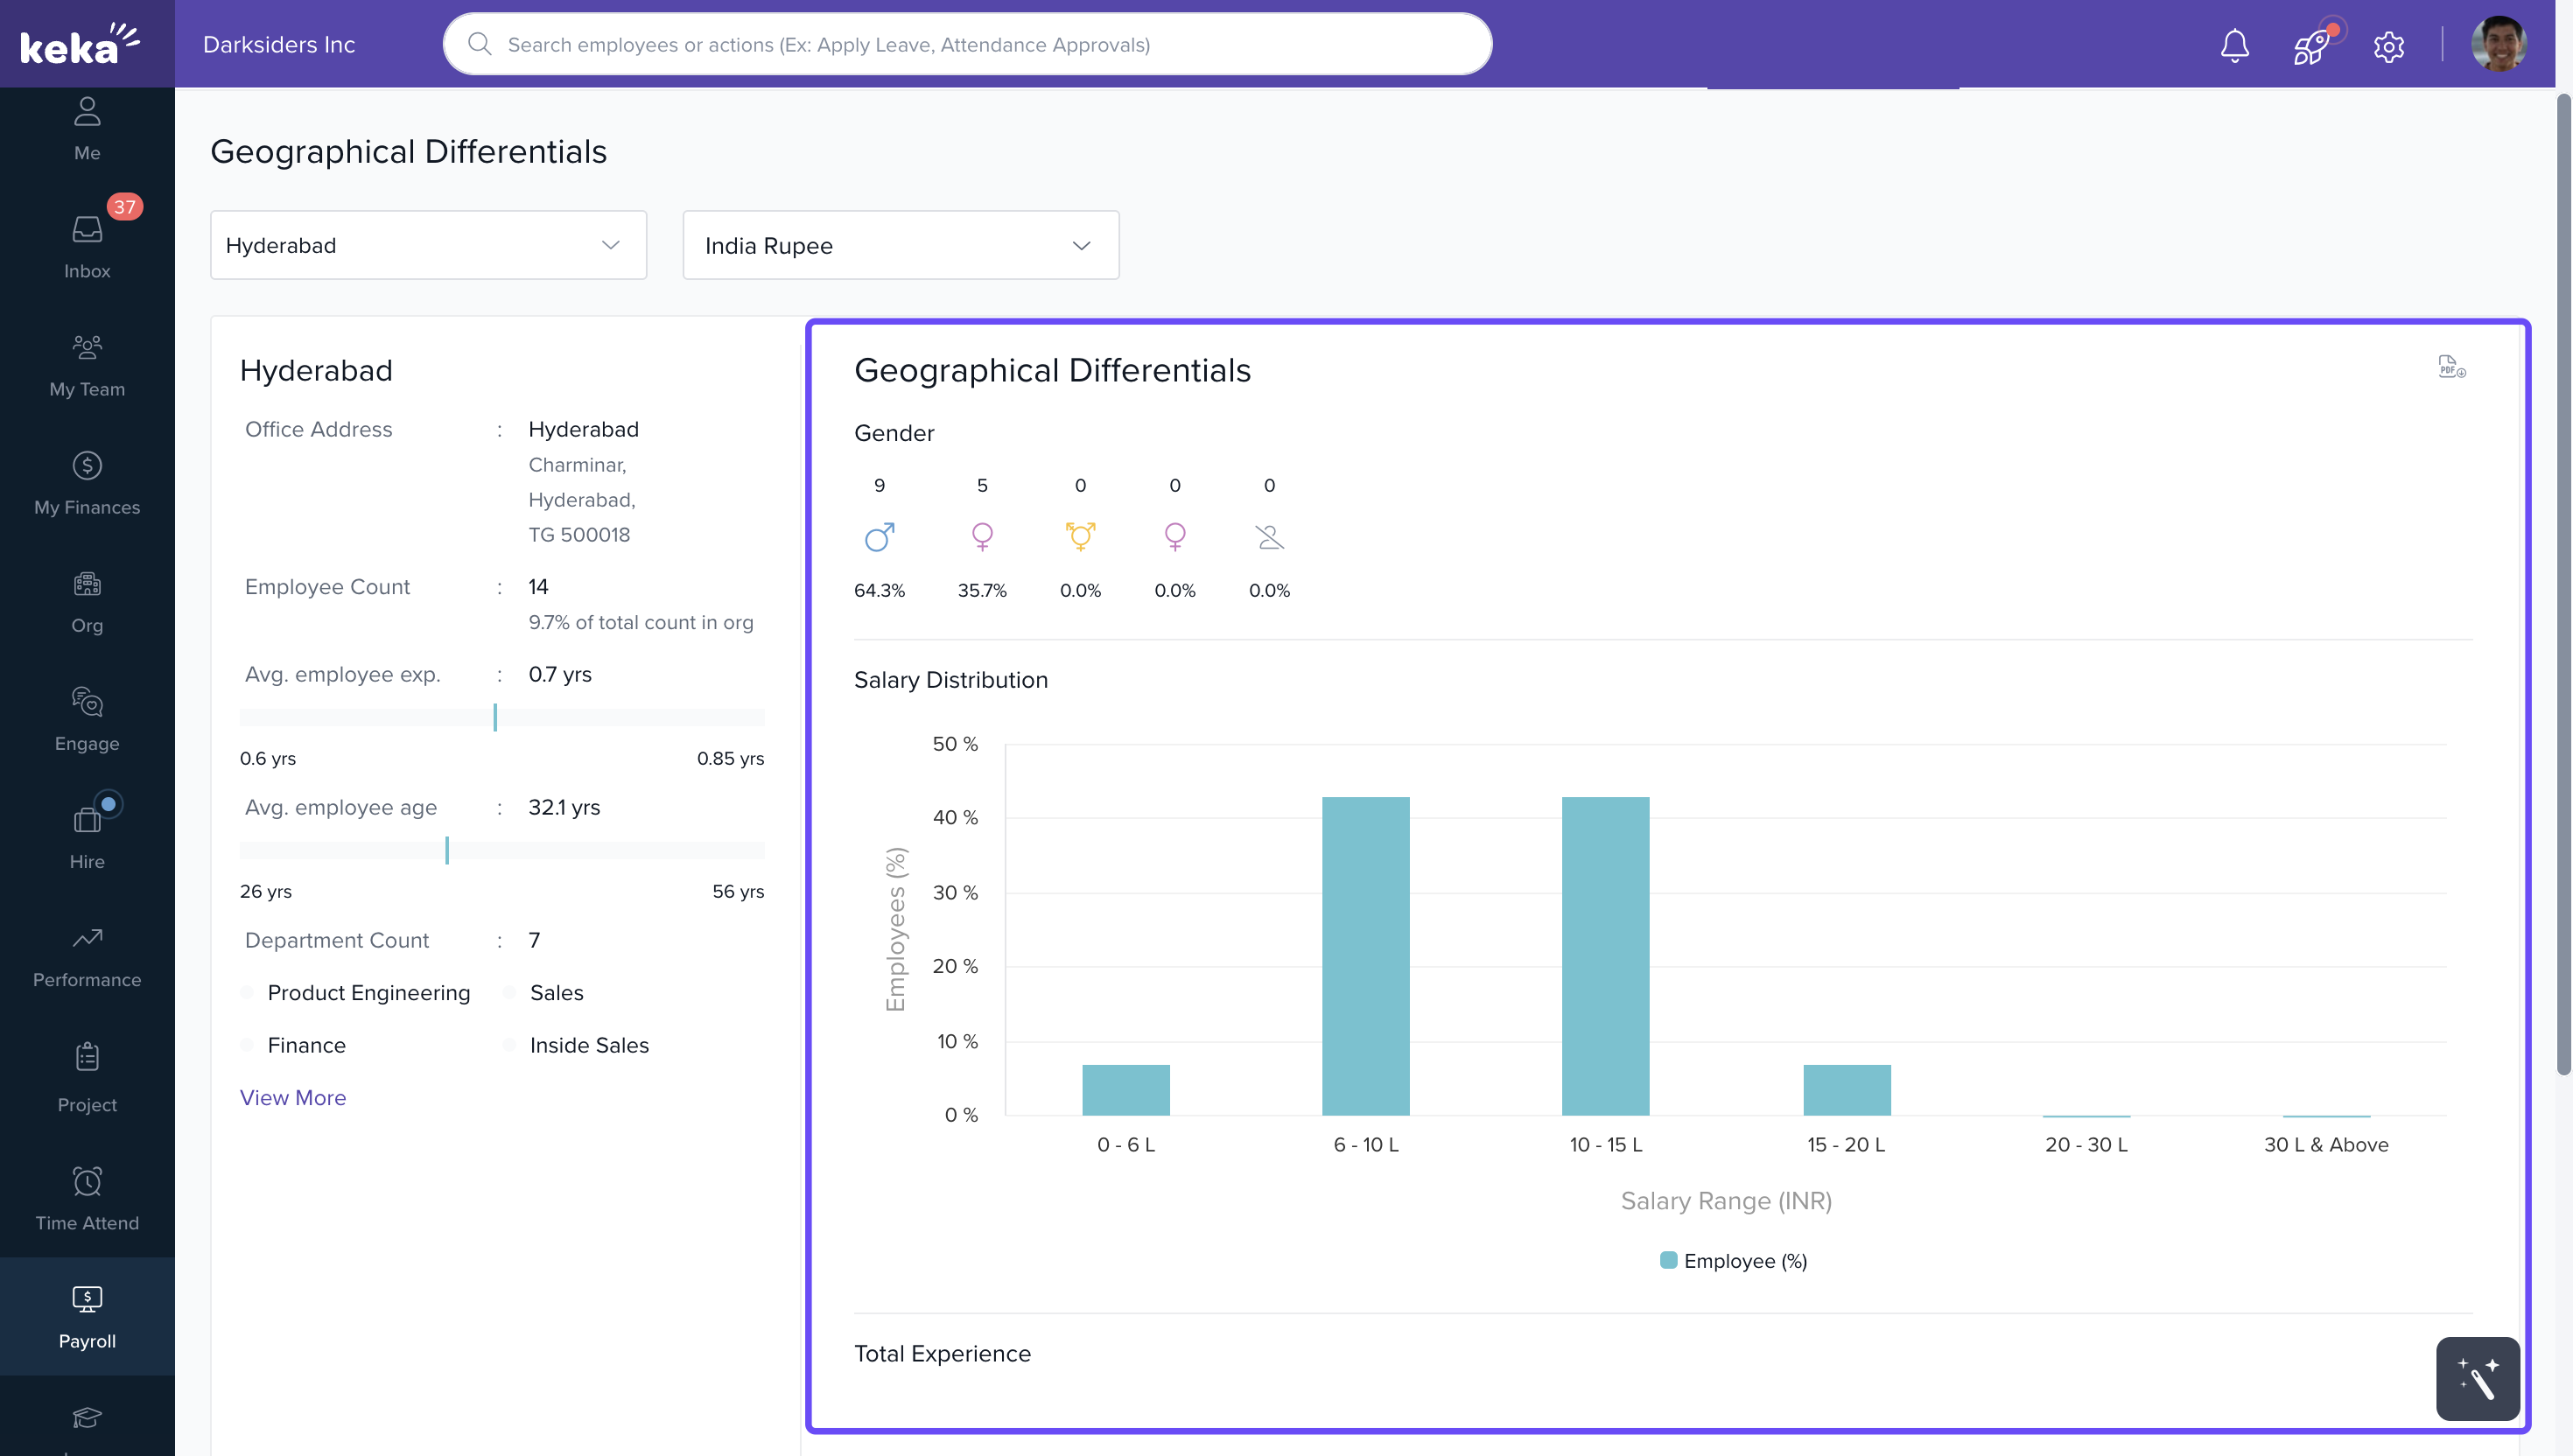
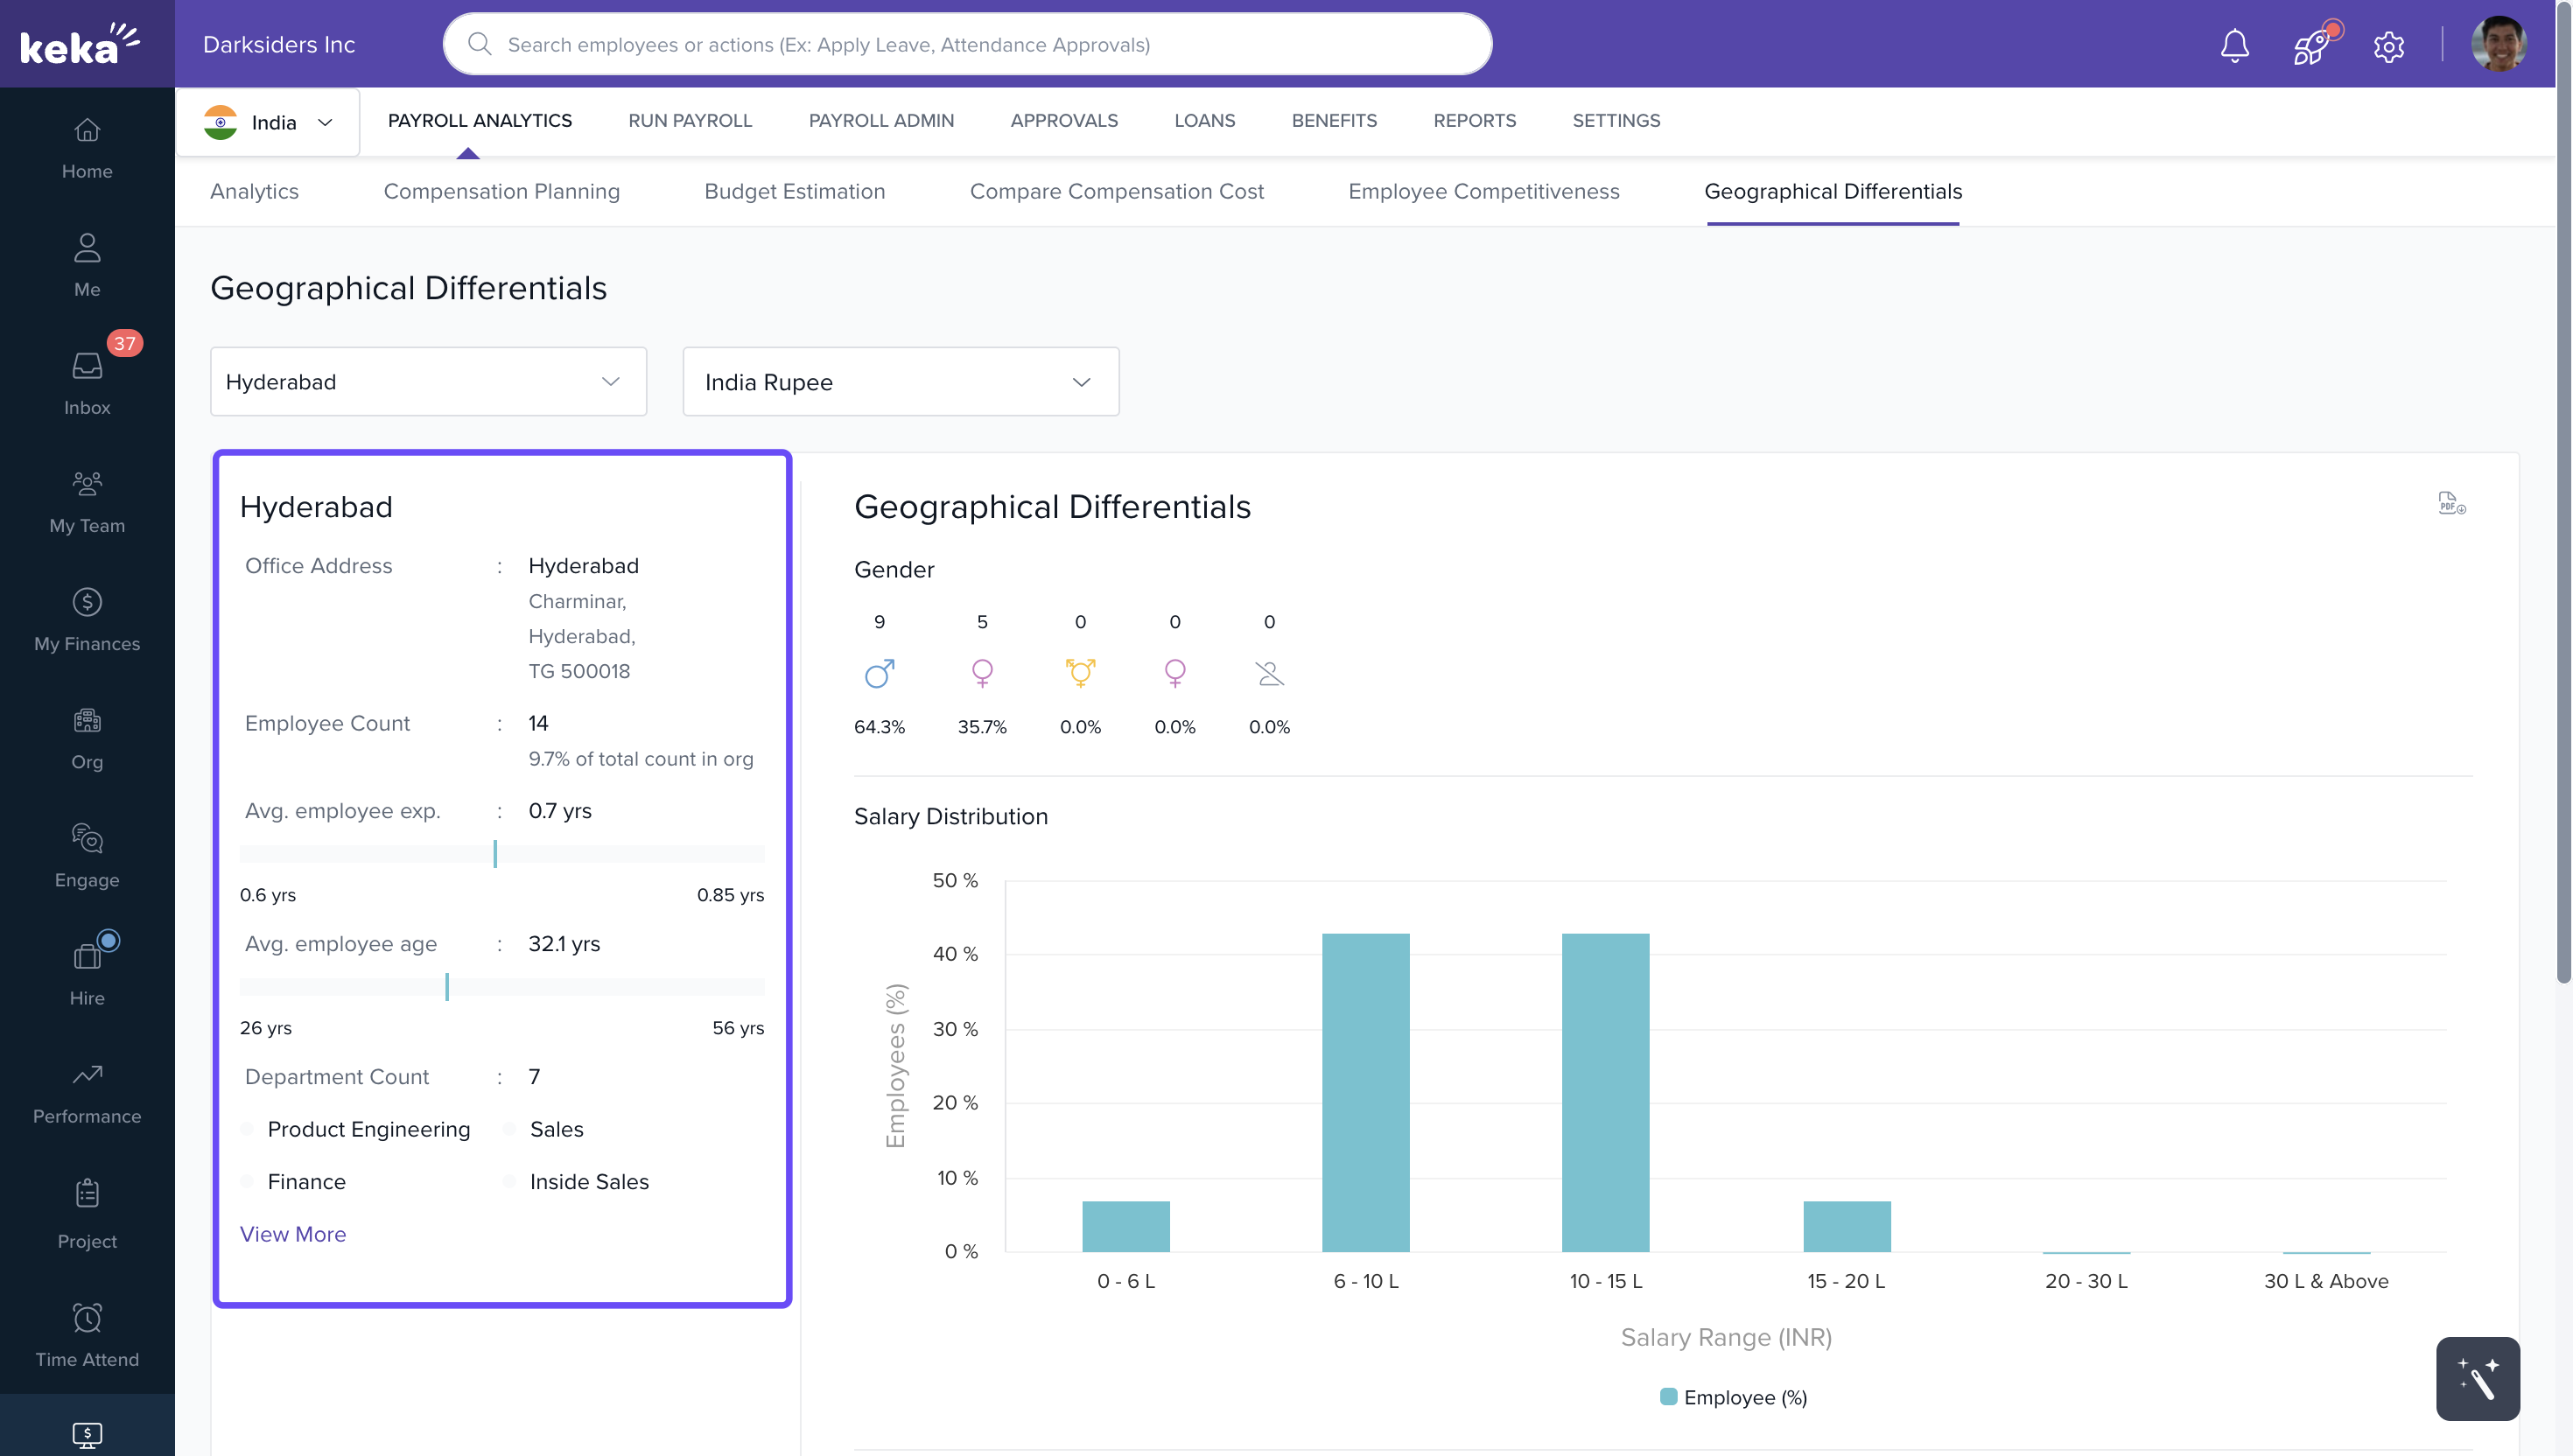
Salary Distribution (Bar Graph)
Displays salary distribution in percentages across different salary ranges.
Gender data is shown at the top of the graph to highlight diversity within the selected location.
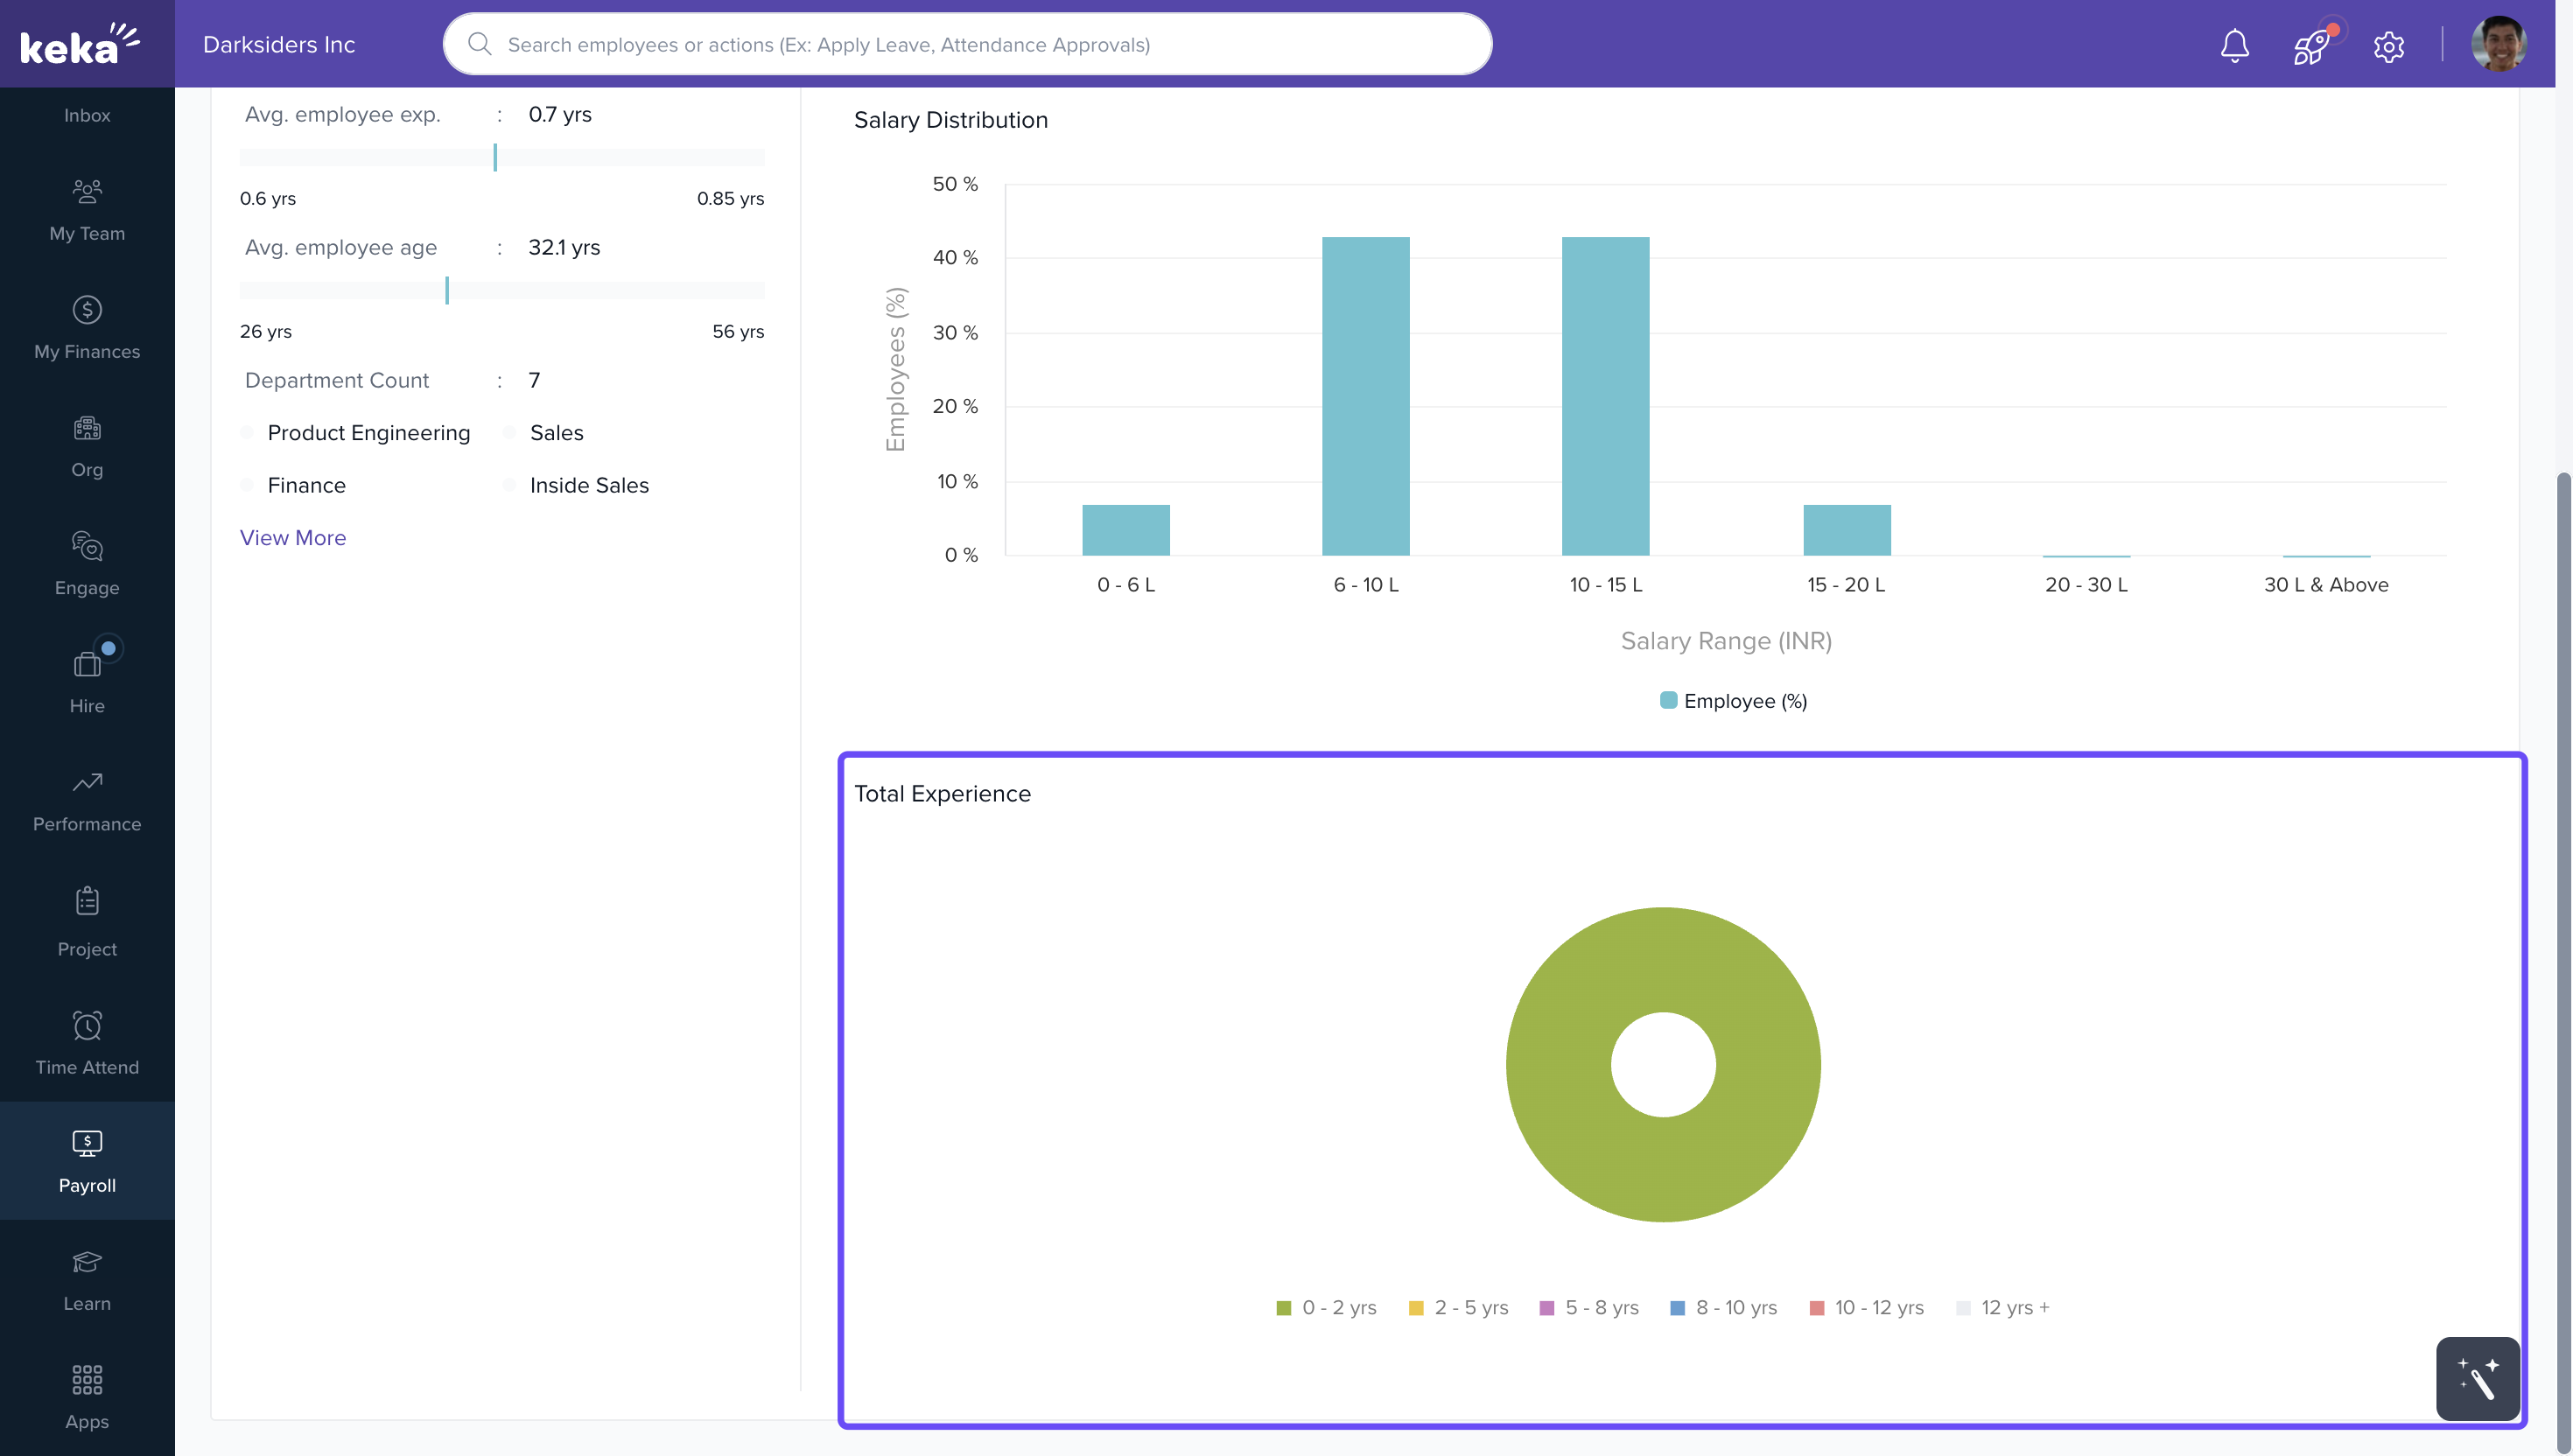
Employee Experience (Pie Chart)
Shows the cumulative employee experience at the location.
You can click the chart to explore detailed experience data.
Location Details (Left Panel)
The left panel gives you a detailed breakdown of:
Location and address
Number of employees
Percentage of total workforce at that location
Average employee experience
Average employee age
Departmental headcount at that location
Downloading Data
To export the displayed data, click the PDF icon on the right-hand side.
A PDF copy of the location-specific analytics will be downloaded.
We hope you now have a good understanding of the Geographical Differentials tab. If you have any further queries, please feel free to reach out to one of our product experts!
Comments
0 comments
Please sign in to leave a comment.