Introduction
The Employee Competitiveness feature helps organizations compare employee compensation across similar roles. It makes it easy to check if employees in equivalent positions are being paid fairly, supporting transparent and equitable pay practices.
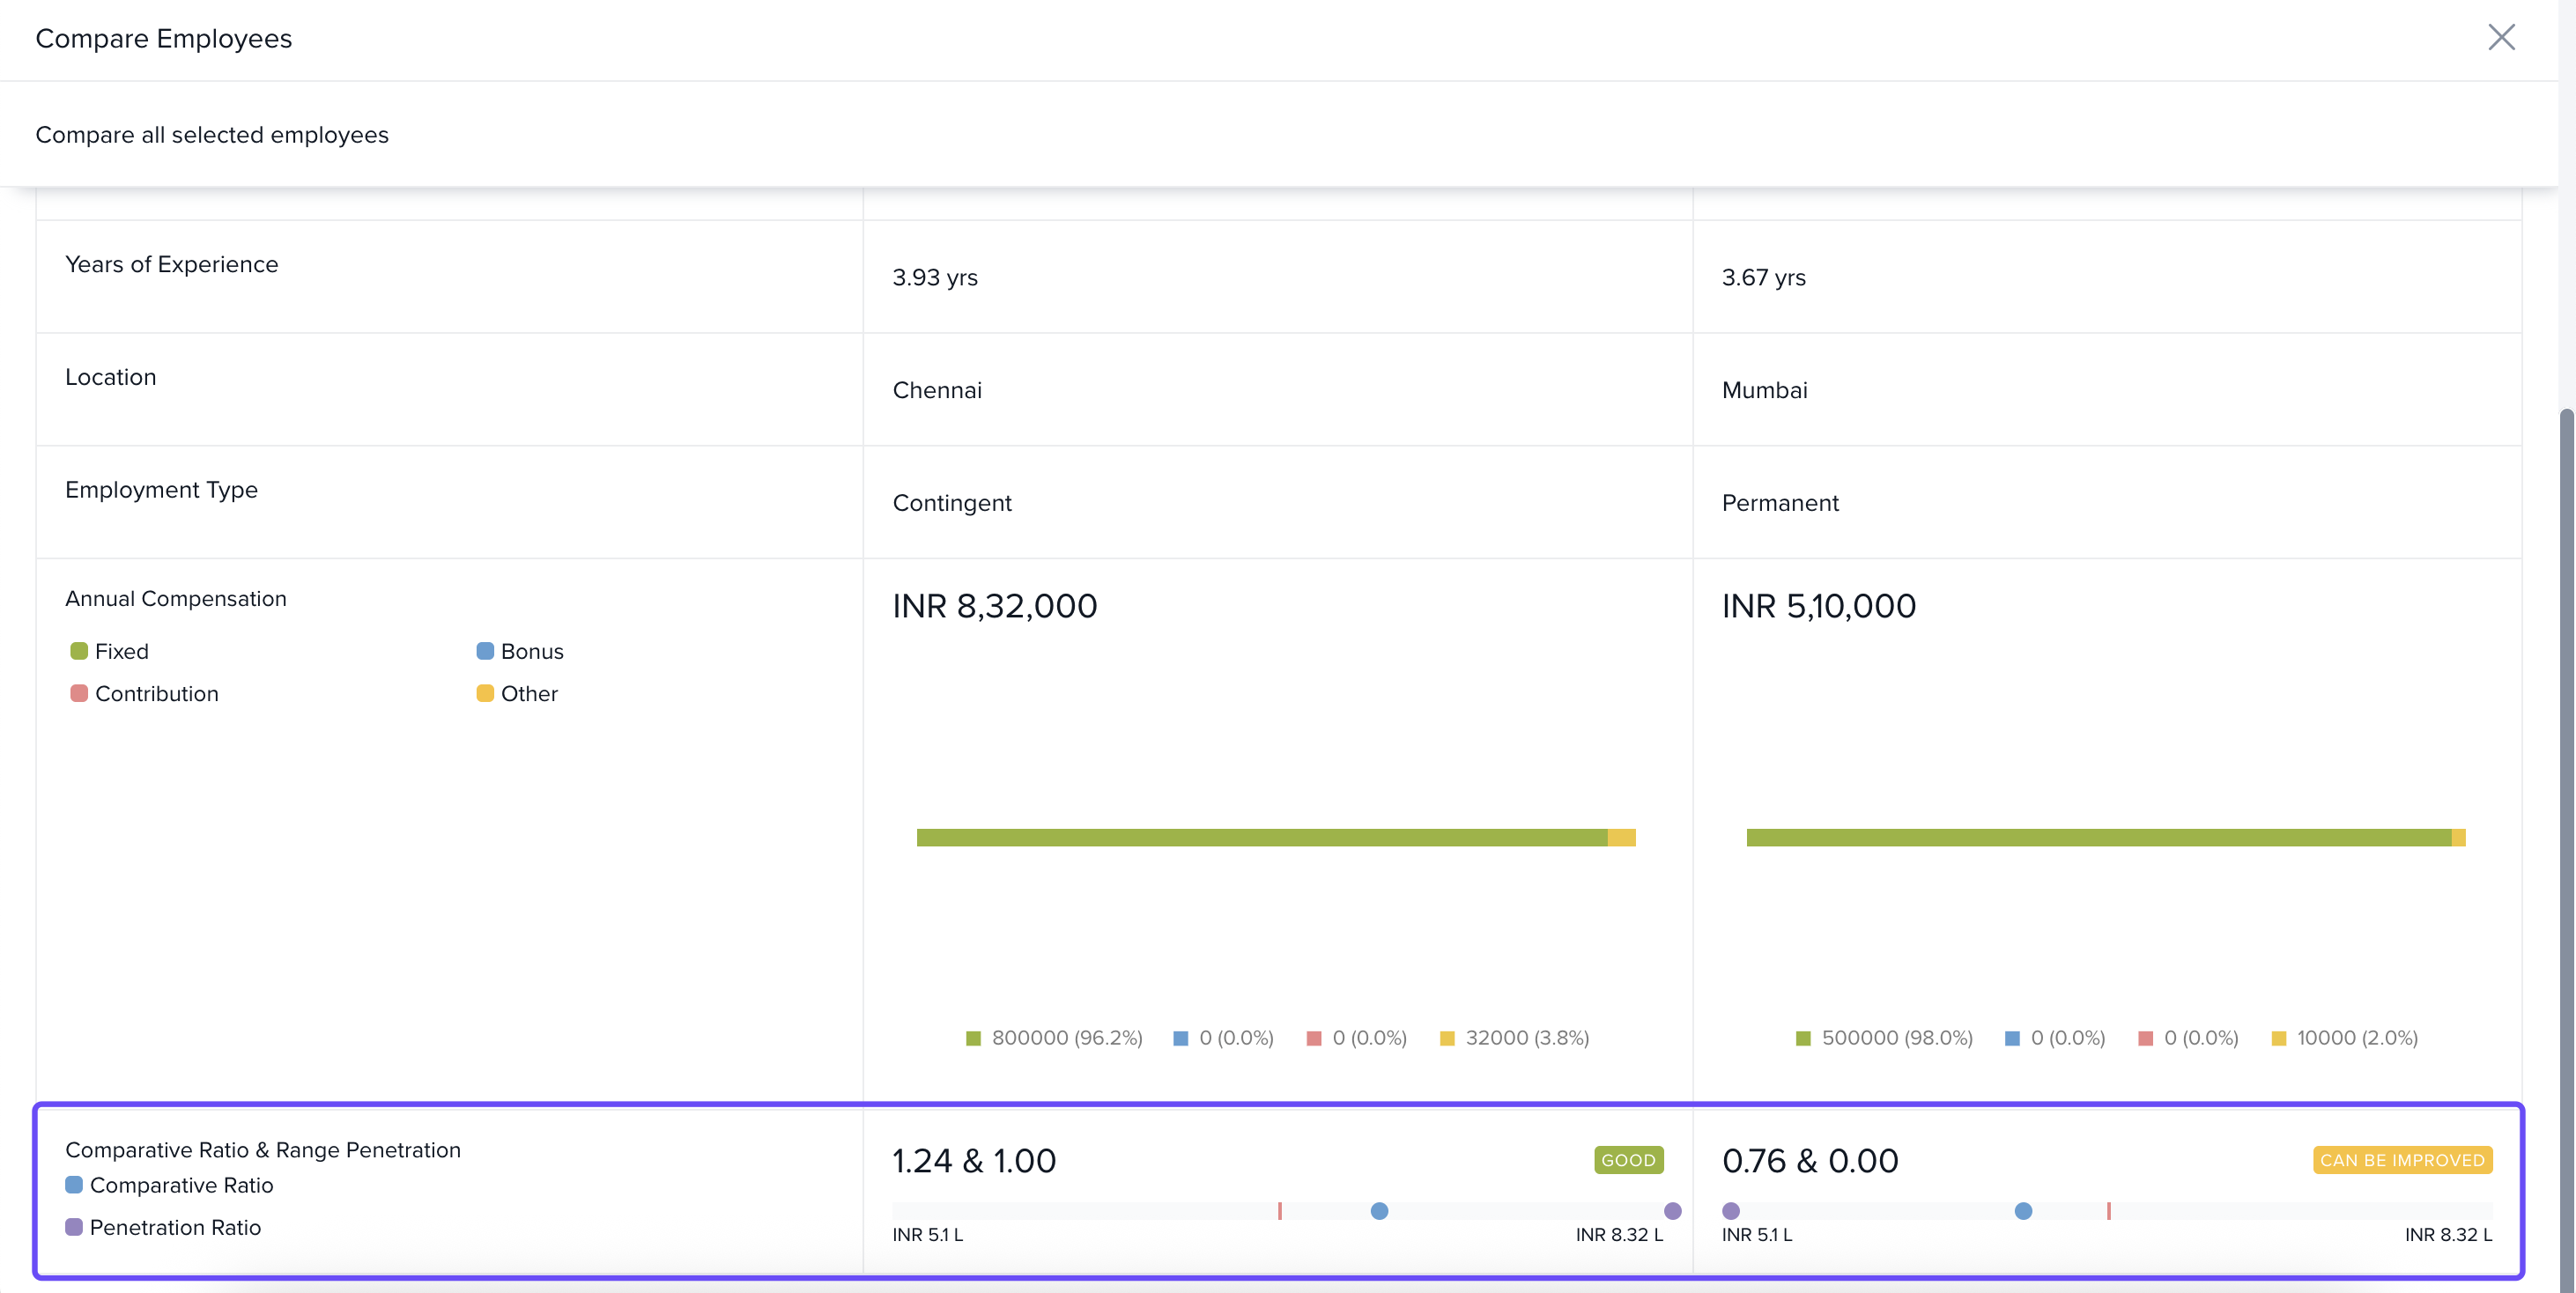
This feature lets you search for any employee, view peers in the same role, and compare key details like role, years of experience, location, employment type, and compensation breakdown. You’ll also see useful pay-grade metrics such as Comparative Ratio and Penetration Ratio.
How to access this Feature?
1. Go to Payroll from the left navigation pane.
2. Click Payroll Analytics.
3. Select Employee Competitiveness.

How to Make Comparisons
Use the Search bar to find an employee.
A list of peers in similar positions will appear.
Select employees by ticking the checkbox next to their names.
Click Compare to see side-by-side details.
Users can make up to three comparisons at a time, and comparisons are limited to individual selected from the provided list.

Parameters Available for Comparison
The comparison view includes three main sections:
Job Details
Role
Business Unit
Years of Experience
Location
Employment Type
Compensation Breakdown
Annual pay is displayed on a scale, broken down into:
Fixed
Bonus
Contribution
Other components
Compensation Metrics
The tool provides two key ratios with a quick status indicator:
Good → if pay is aligned
Can be improved → if misalignment is detected
Comparative Ratio (Compa-Ratio)
This ratio compares an employee’s salary to the midpoint of the pay range.
Formula:
Comparative Ratio = Employee Salary ÷ Range Midpoint
1.0 (100%) → Salary equals the midpoint
< 1.0 → Salary is below midpoint
> 1.0 → Salary is above midpoint
Note: The midpoint is exactly between the range minimum and maximum.
Example:
If the salary range is ₹60,000–₹90,000, the midpoint is ₹75,000.
Pooja earns ₹70,000.
Comparative Ratio = 70,000 ÷ 75,000 = 0.93 (93%)
This means she earns slightly below the midpoint.
Note: The range midpoint here is the exact middle of the range, equidistant from range minimum and range maximum.
Penetration Ratio
This ratio shows how far an employee’s salary has progressed within the full salary range. It highlights how much room there is for growth.
Formula:
Penetration Ratio = (Salary – Range Minimum) ÷ (Range Maximum – Range Minimum)
Example:
Pooja’s range is ₹60,000–₹90,000 and her salary is ₹70,000.
Penetration Ratio = (70,000 – 60,000) ÷ (90,000 – 60,000) = 33%
This means Pooja’s salary has reached one-third of her pay range.
In conclusion this tab makes it simple for the organization to check if people at the same level are paid fairly, helping them ensure everyone gets fair pay.
Comments
0 comments
Please sign in to leave a comment.