Overview
In this guide, you will learn:
- How to access the Project Manager Dashboard from the project summary page
- What charts and widgets are available
- How to customize your dashboard layout
- How to view financial metrics like cost, revenue, and margins
- Who can access the dashboard and how to manage permissions
Who Can Do This?
- Project Managers and Client Managers (default access for their own projects)
- PSA Admins and Global Admins (default access to all projects)
- Other users with assigned “View Project” and “View Financials” permissions
Pre-requisites
- You must be added to the project or have global/project-level access.
- To view financial data, permissions must explicitly include financial access.
- Timesheet and billing data should be updated to reflect accurate charts.
Accessing the Project Manager Dashboard
- Log in to the Keka portal.
- Navigate to Projects > click on preferred project.
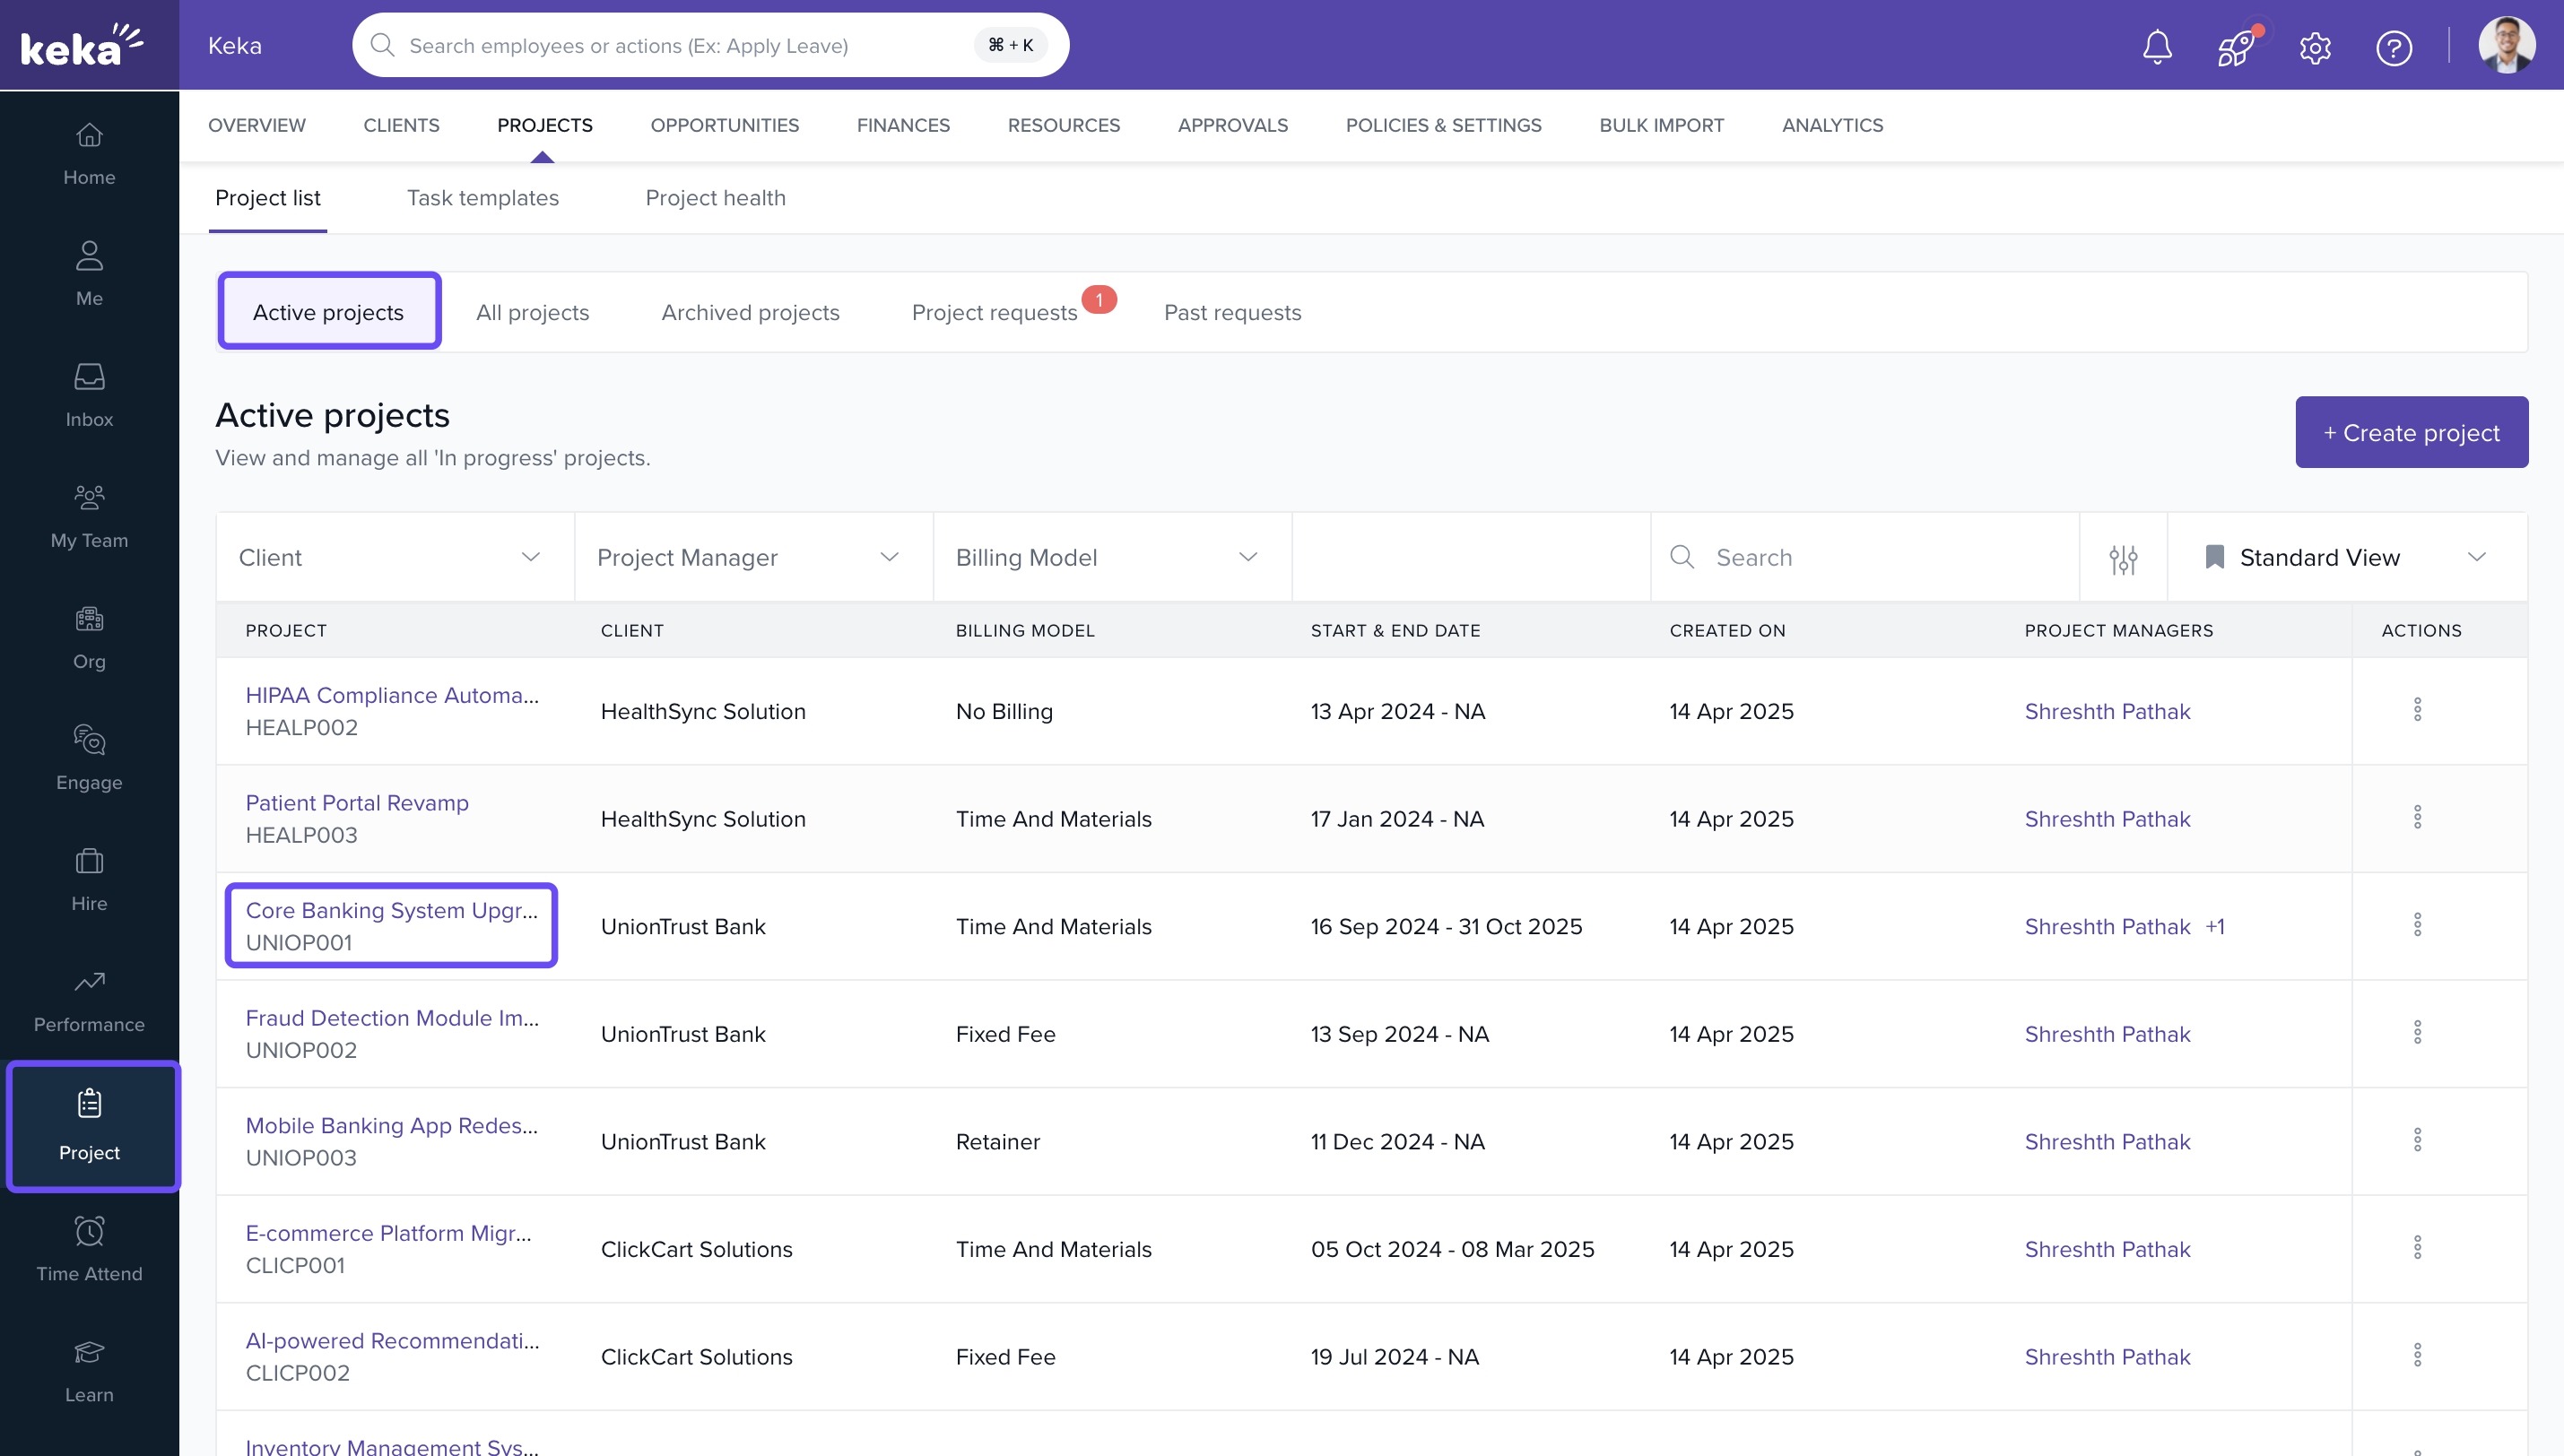
- Click on the overview tab.
- The Project Manager Dashboard will load automatically.
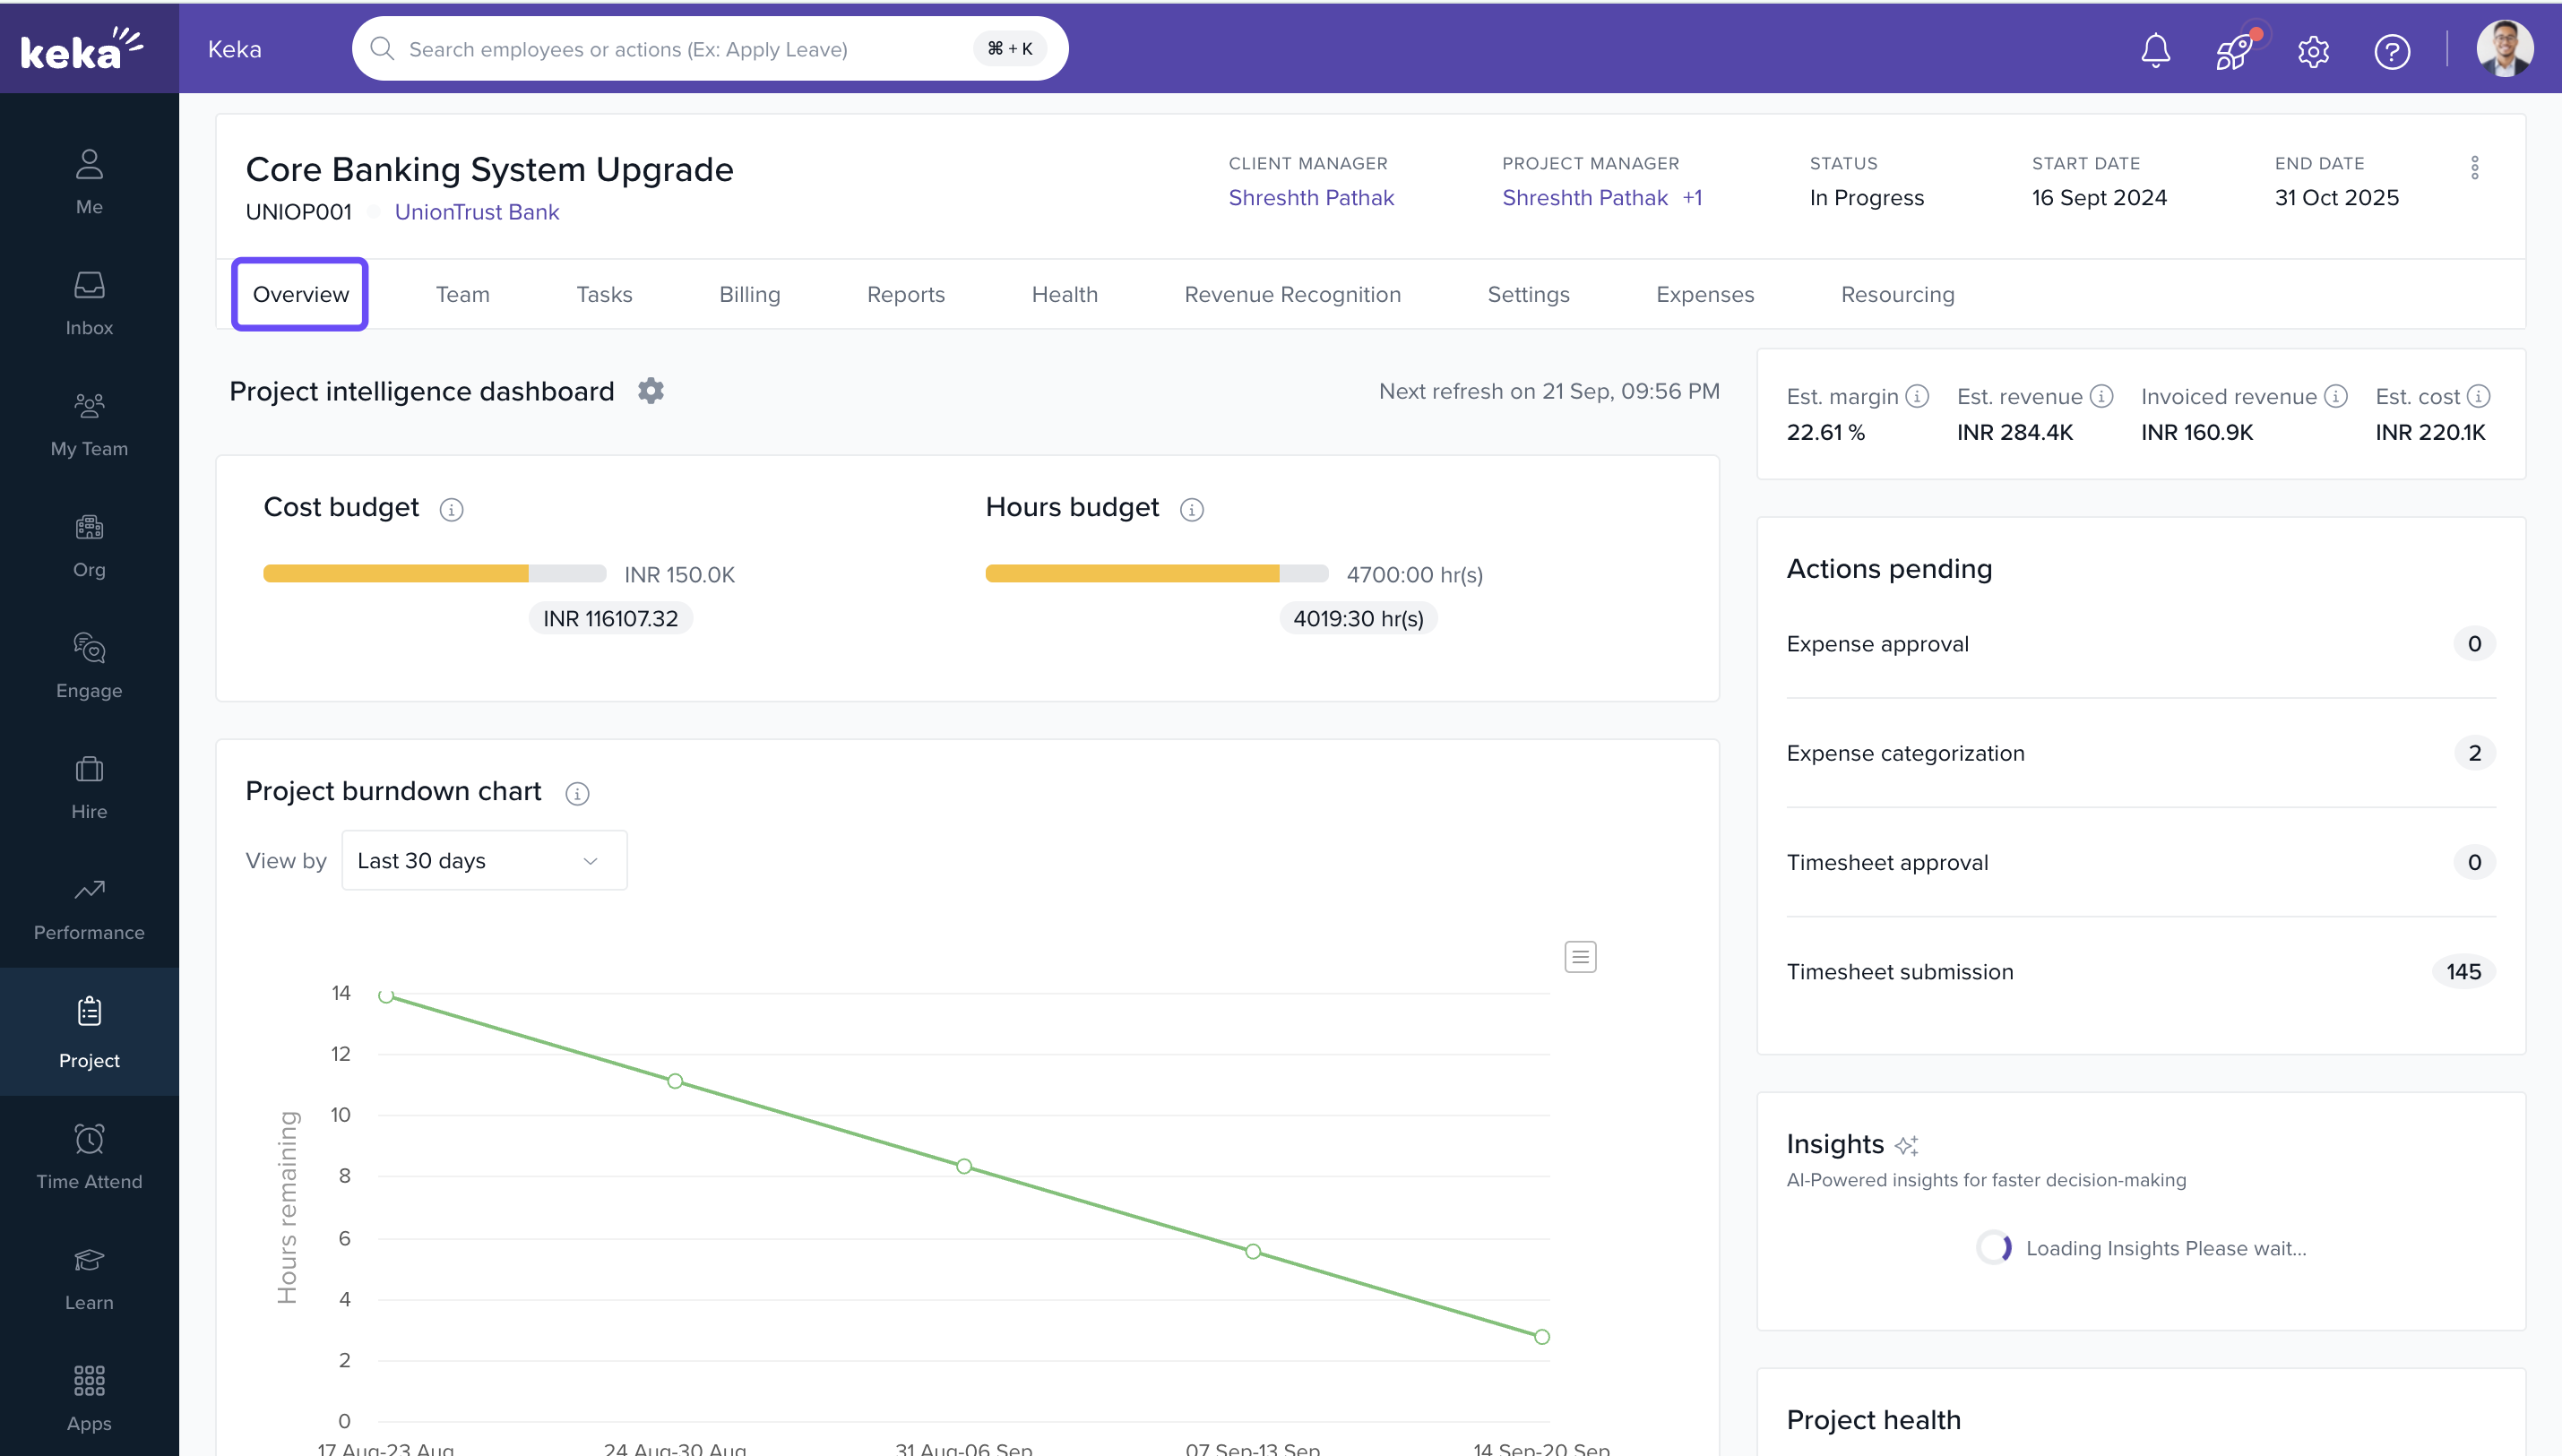
Review Dashboard Charts
- Time and Budget Summary
- Utilization & Time Spent (Over Time)
- Utilization & Time Spent (by Role/Resource)
- Project Burn Down Chart
- Task: Estimated vs Actual
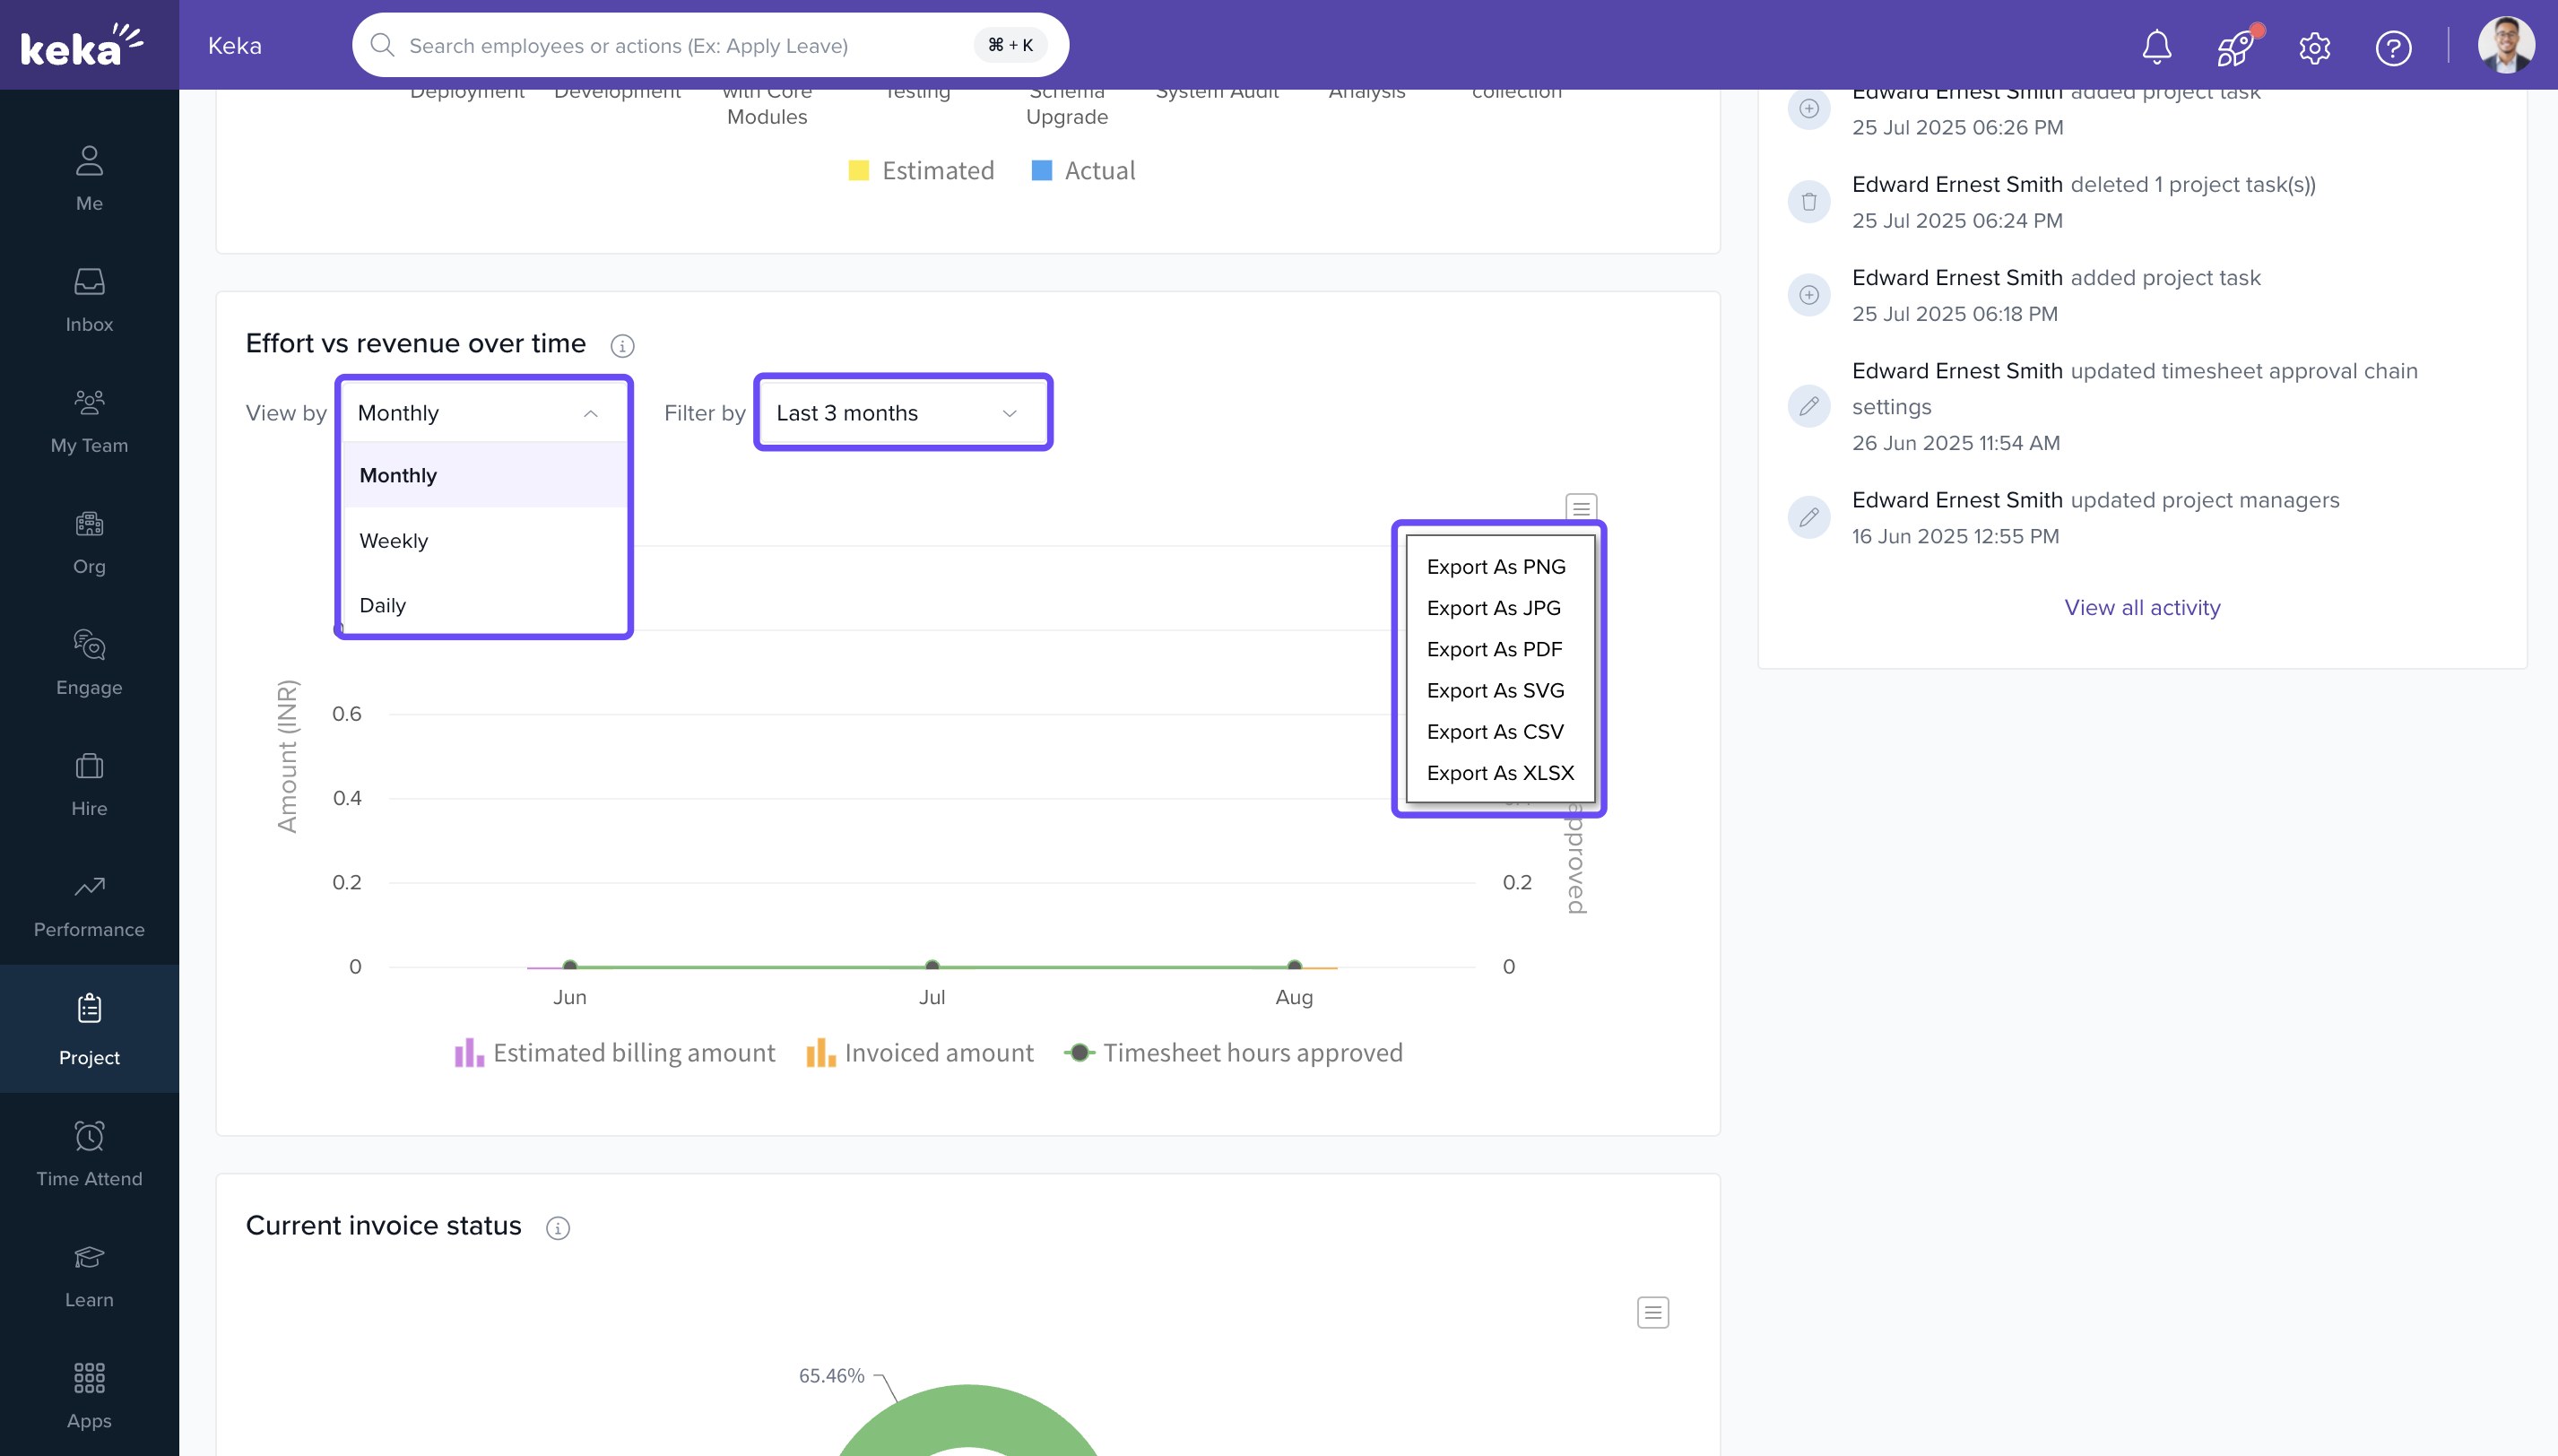
- Effort vs Revenue Over Time
- Planned vs Actual Cost, Profit & Margin
- Invoice Status Overview
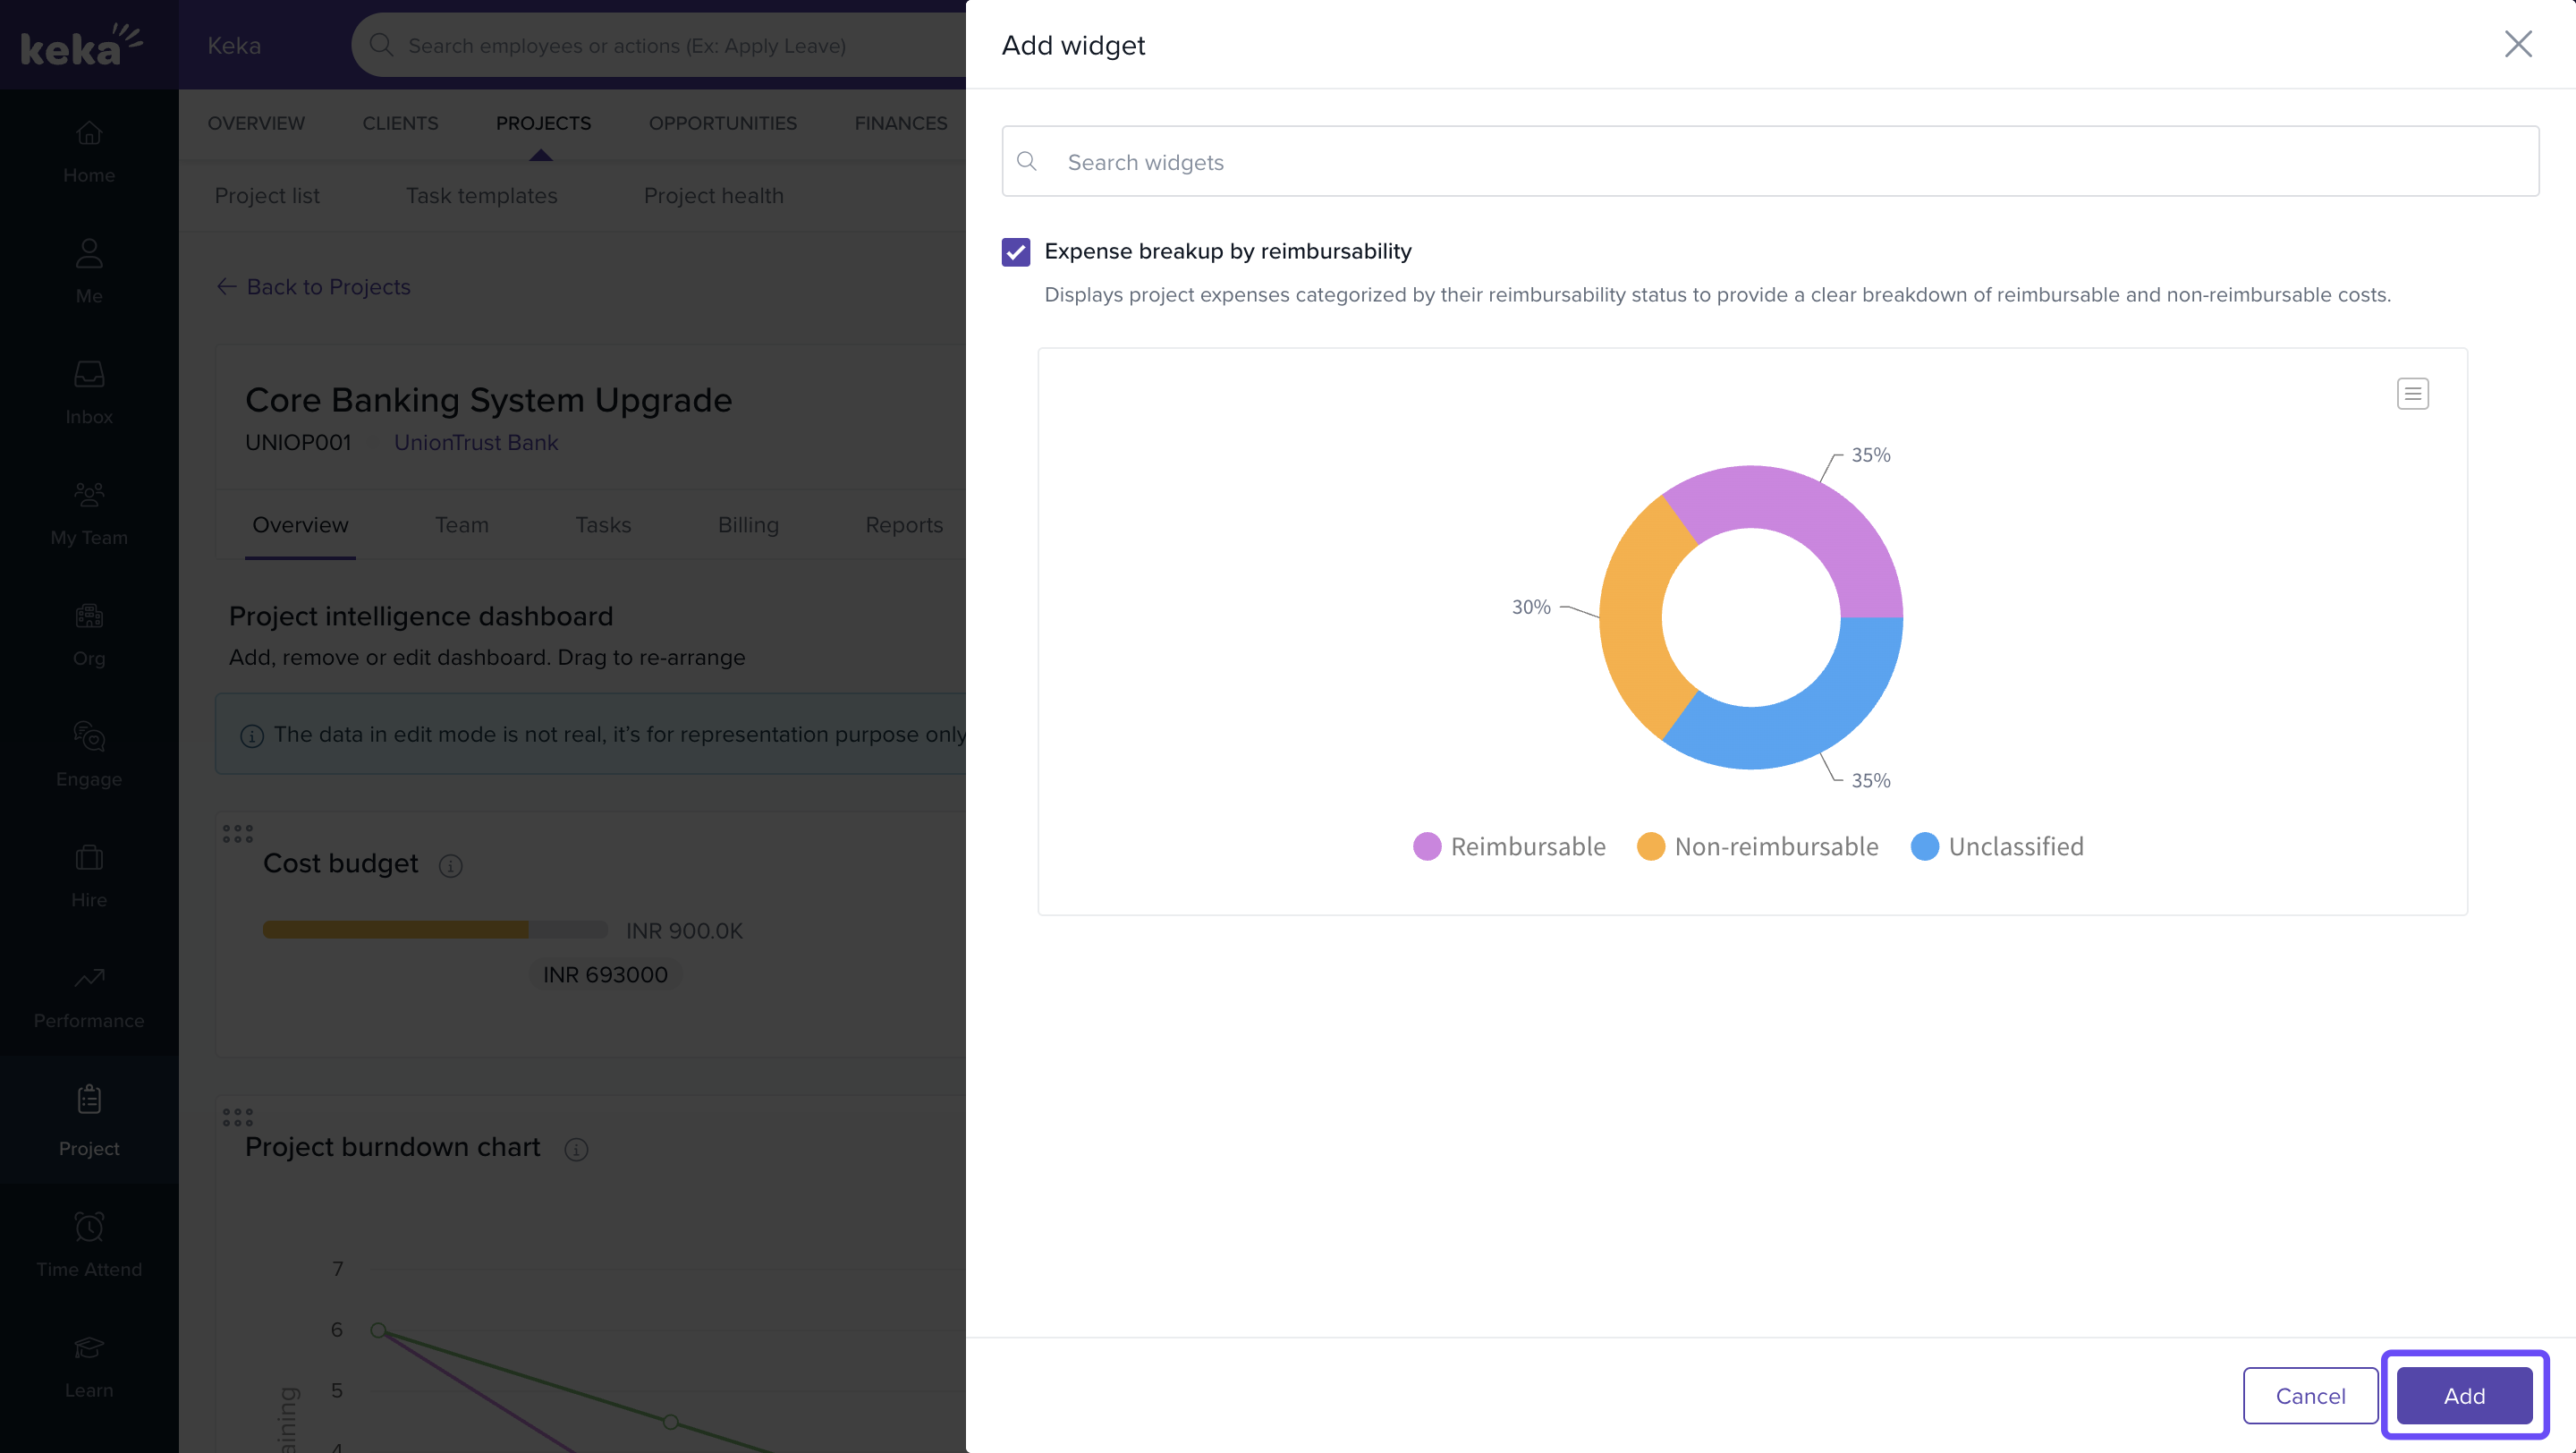
- Expense Breakup
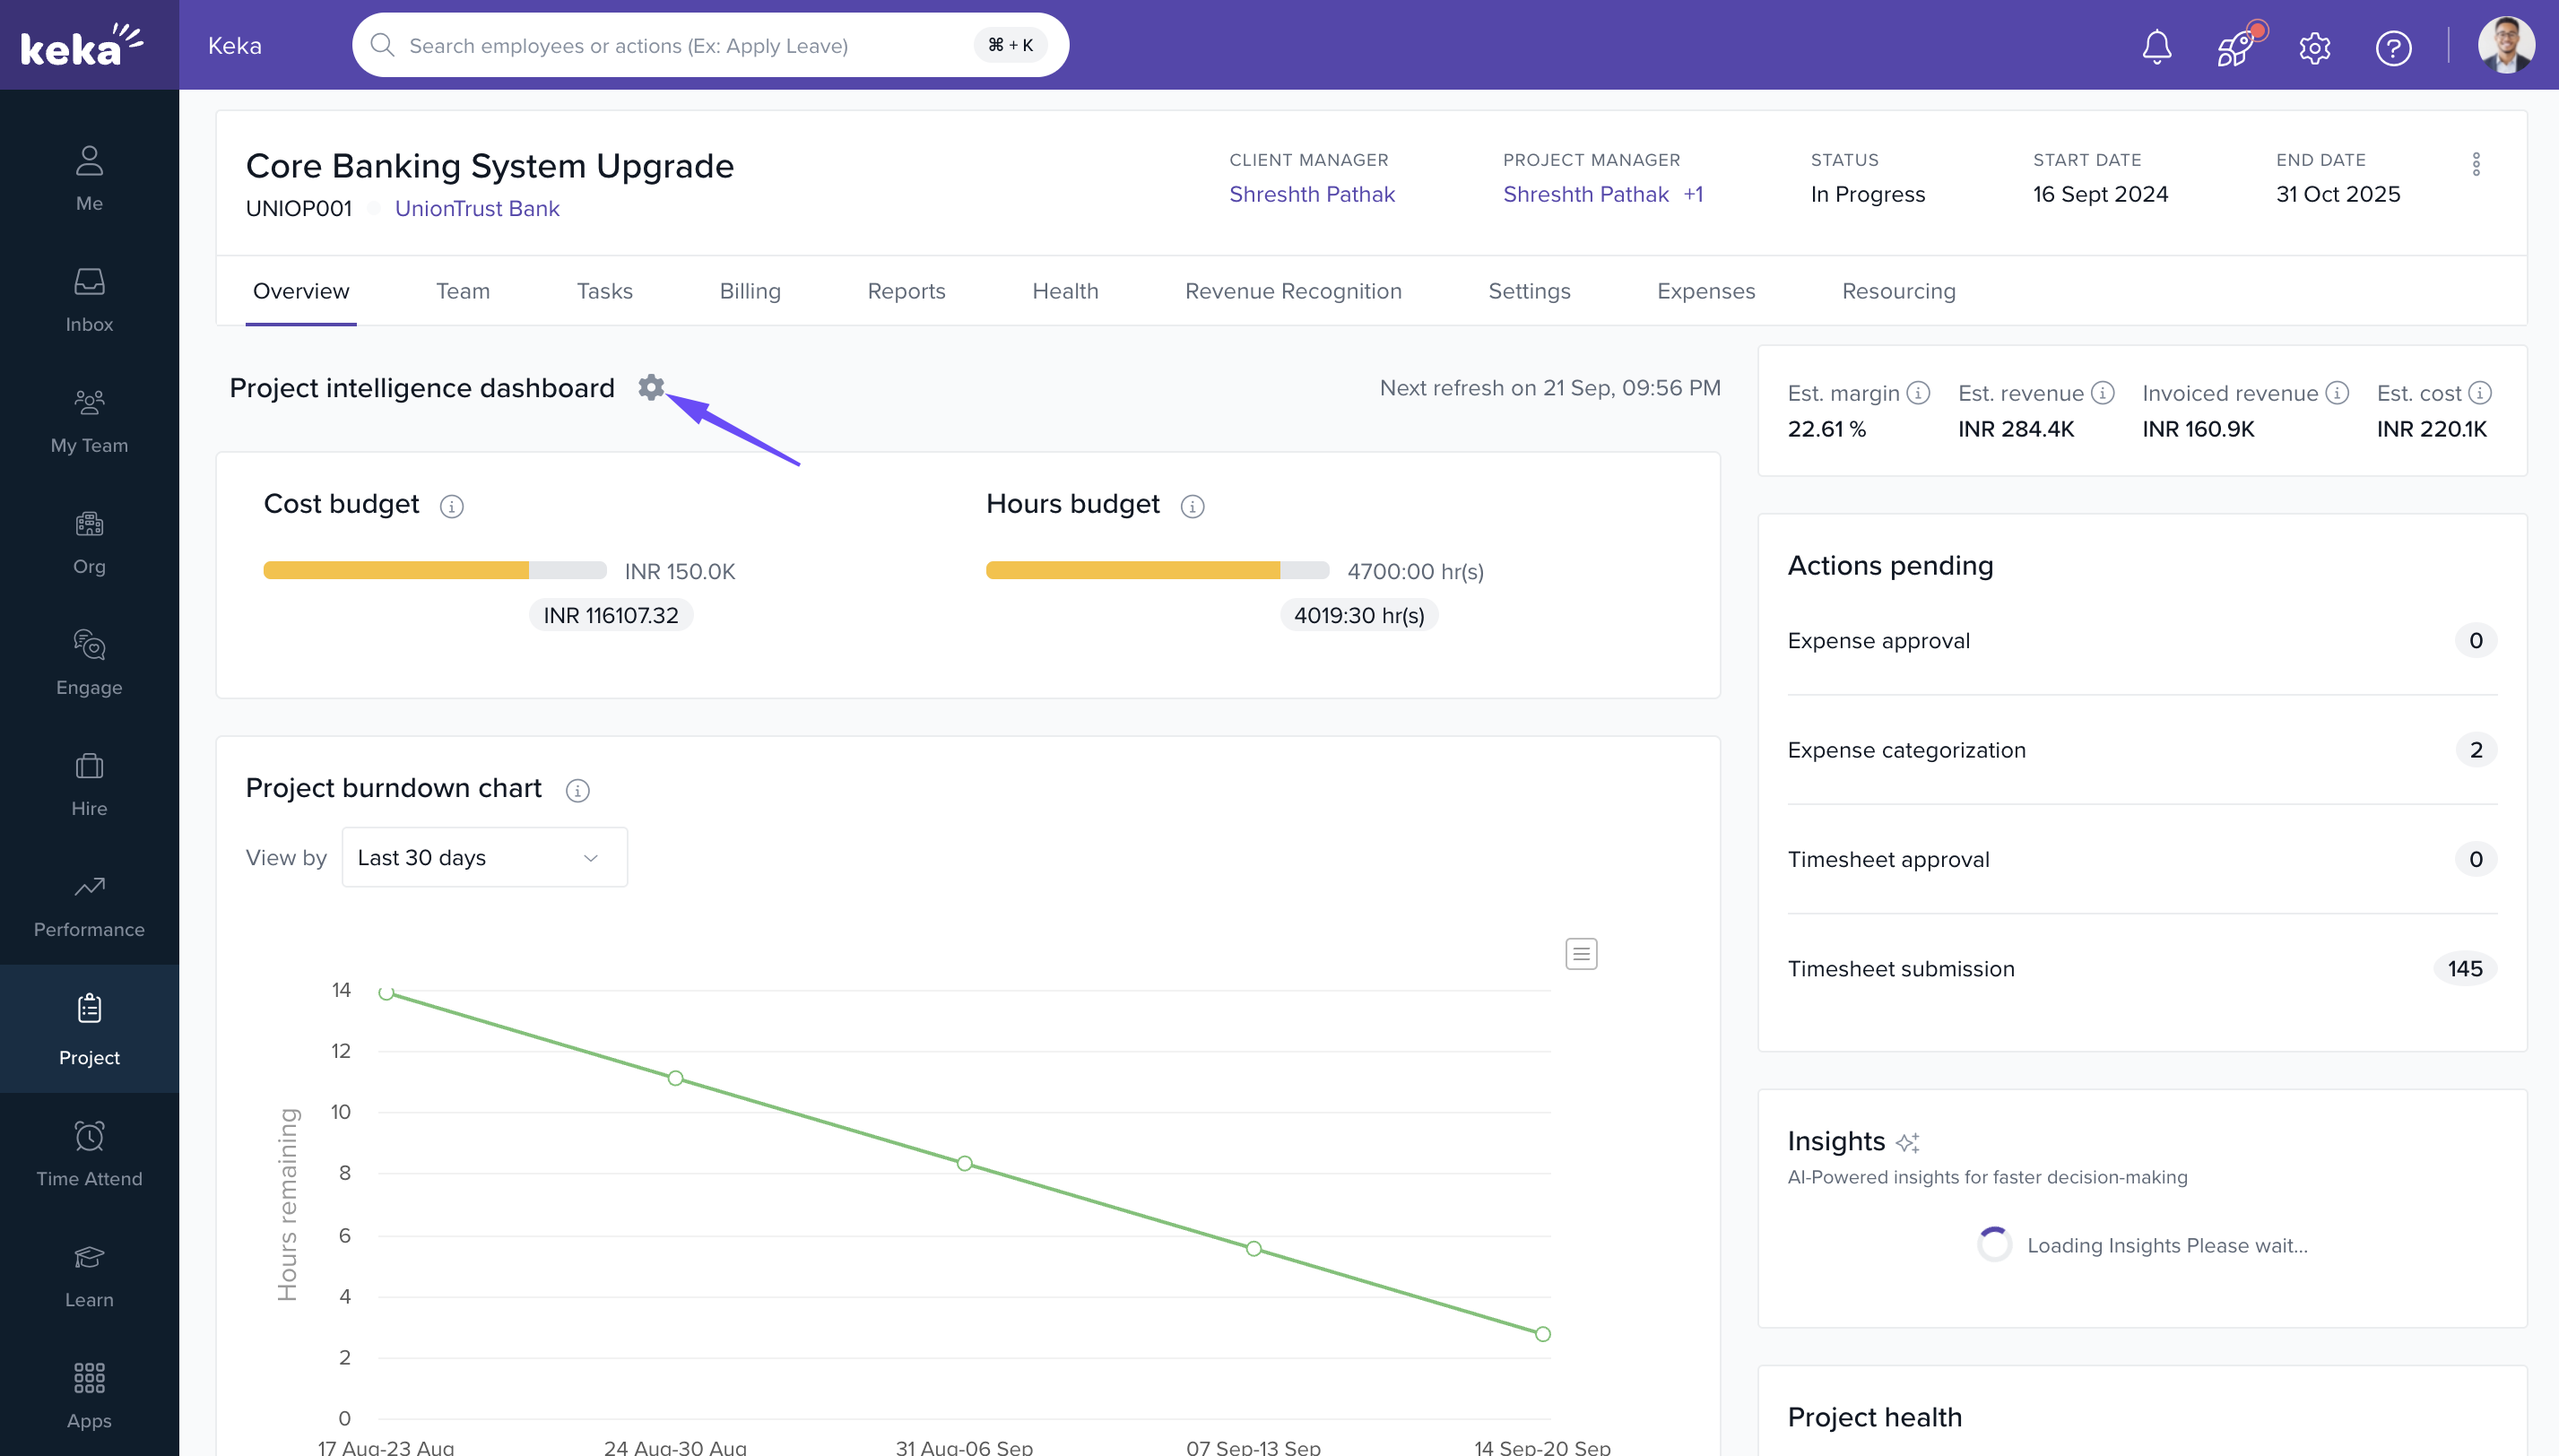
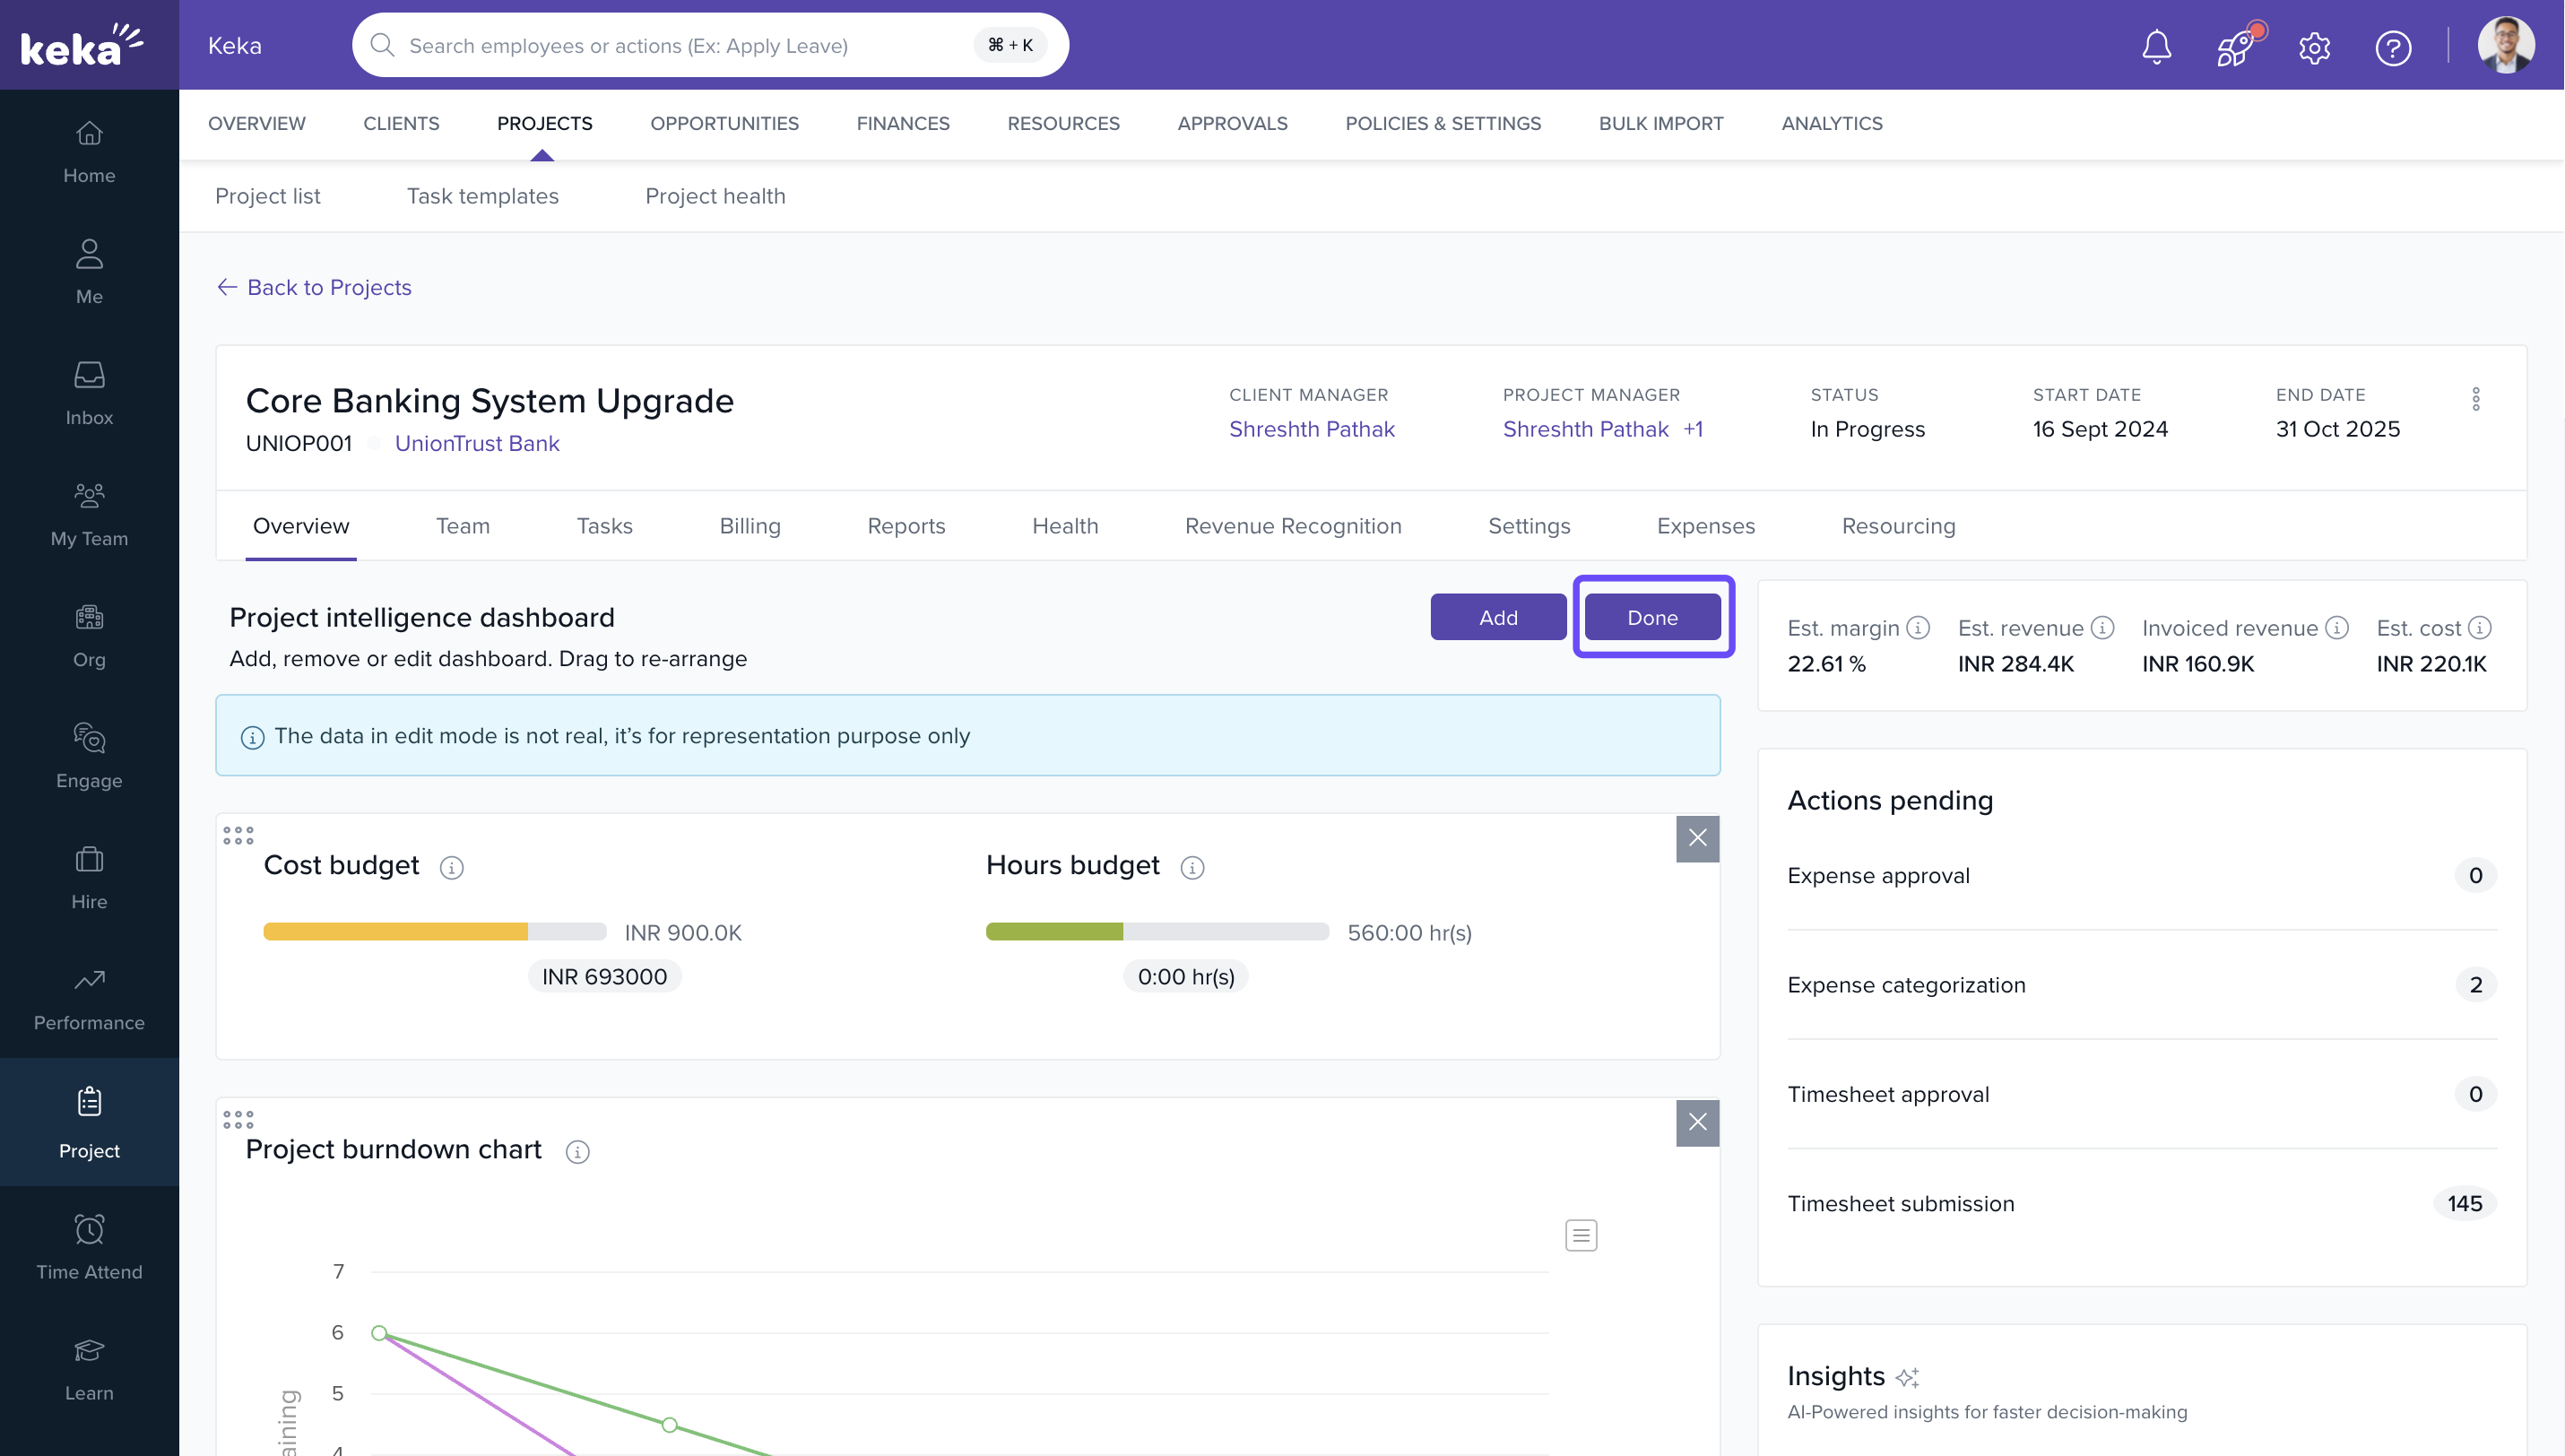
Customising Your Dashboard
- Click the Settings icon at the top of the dashboard.
- Drag and place charts as per your preference.
- Use + Add Chart to include more visual insights.
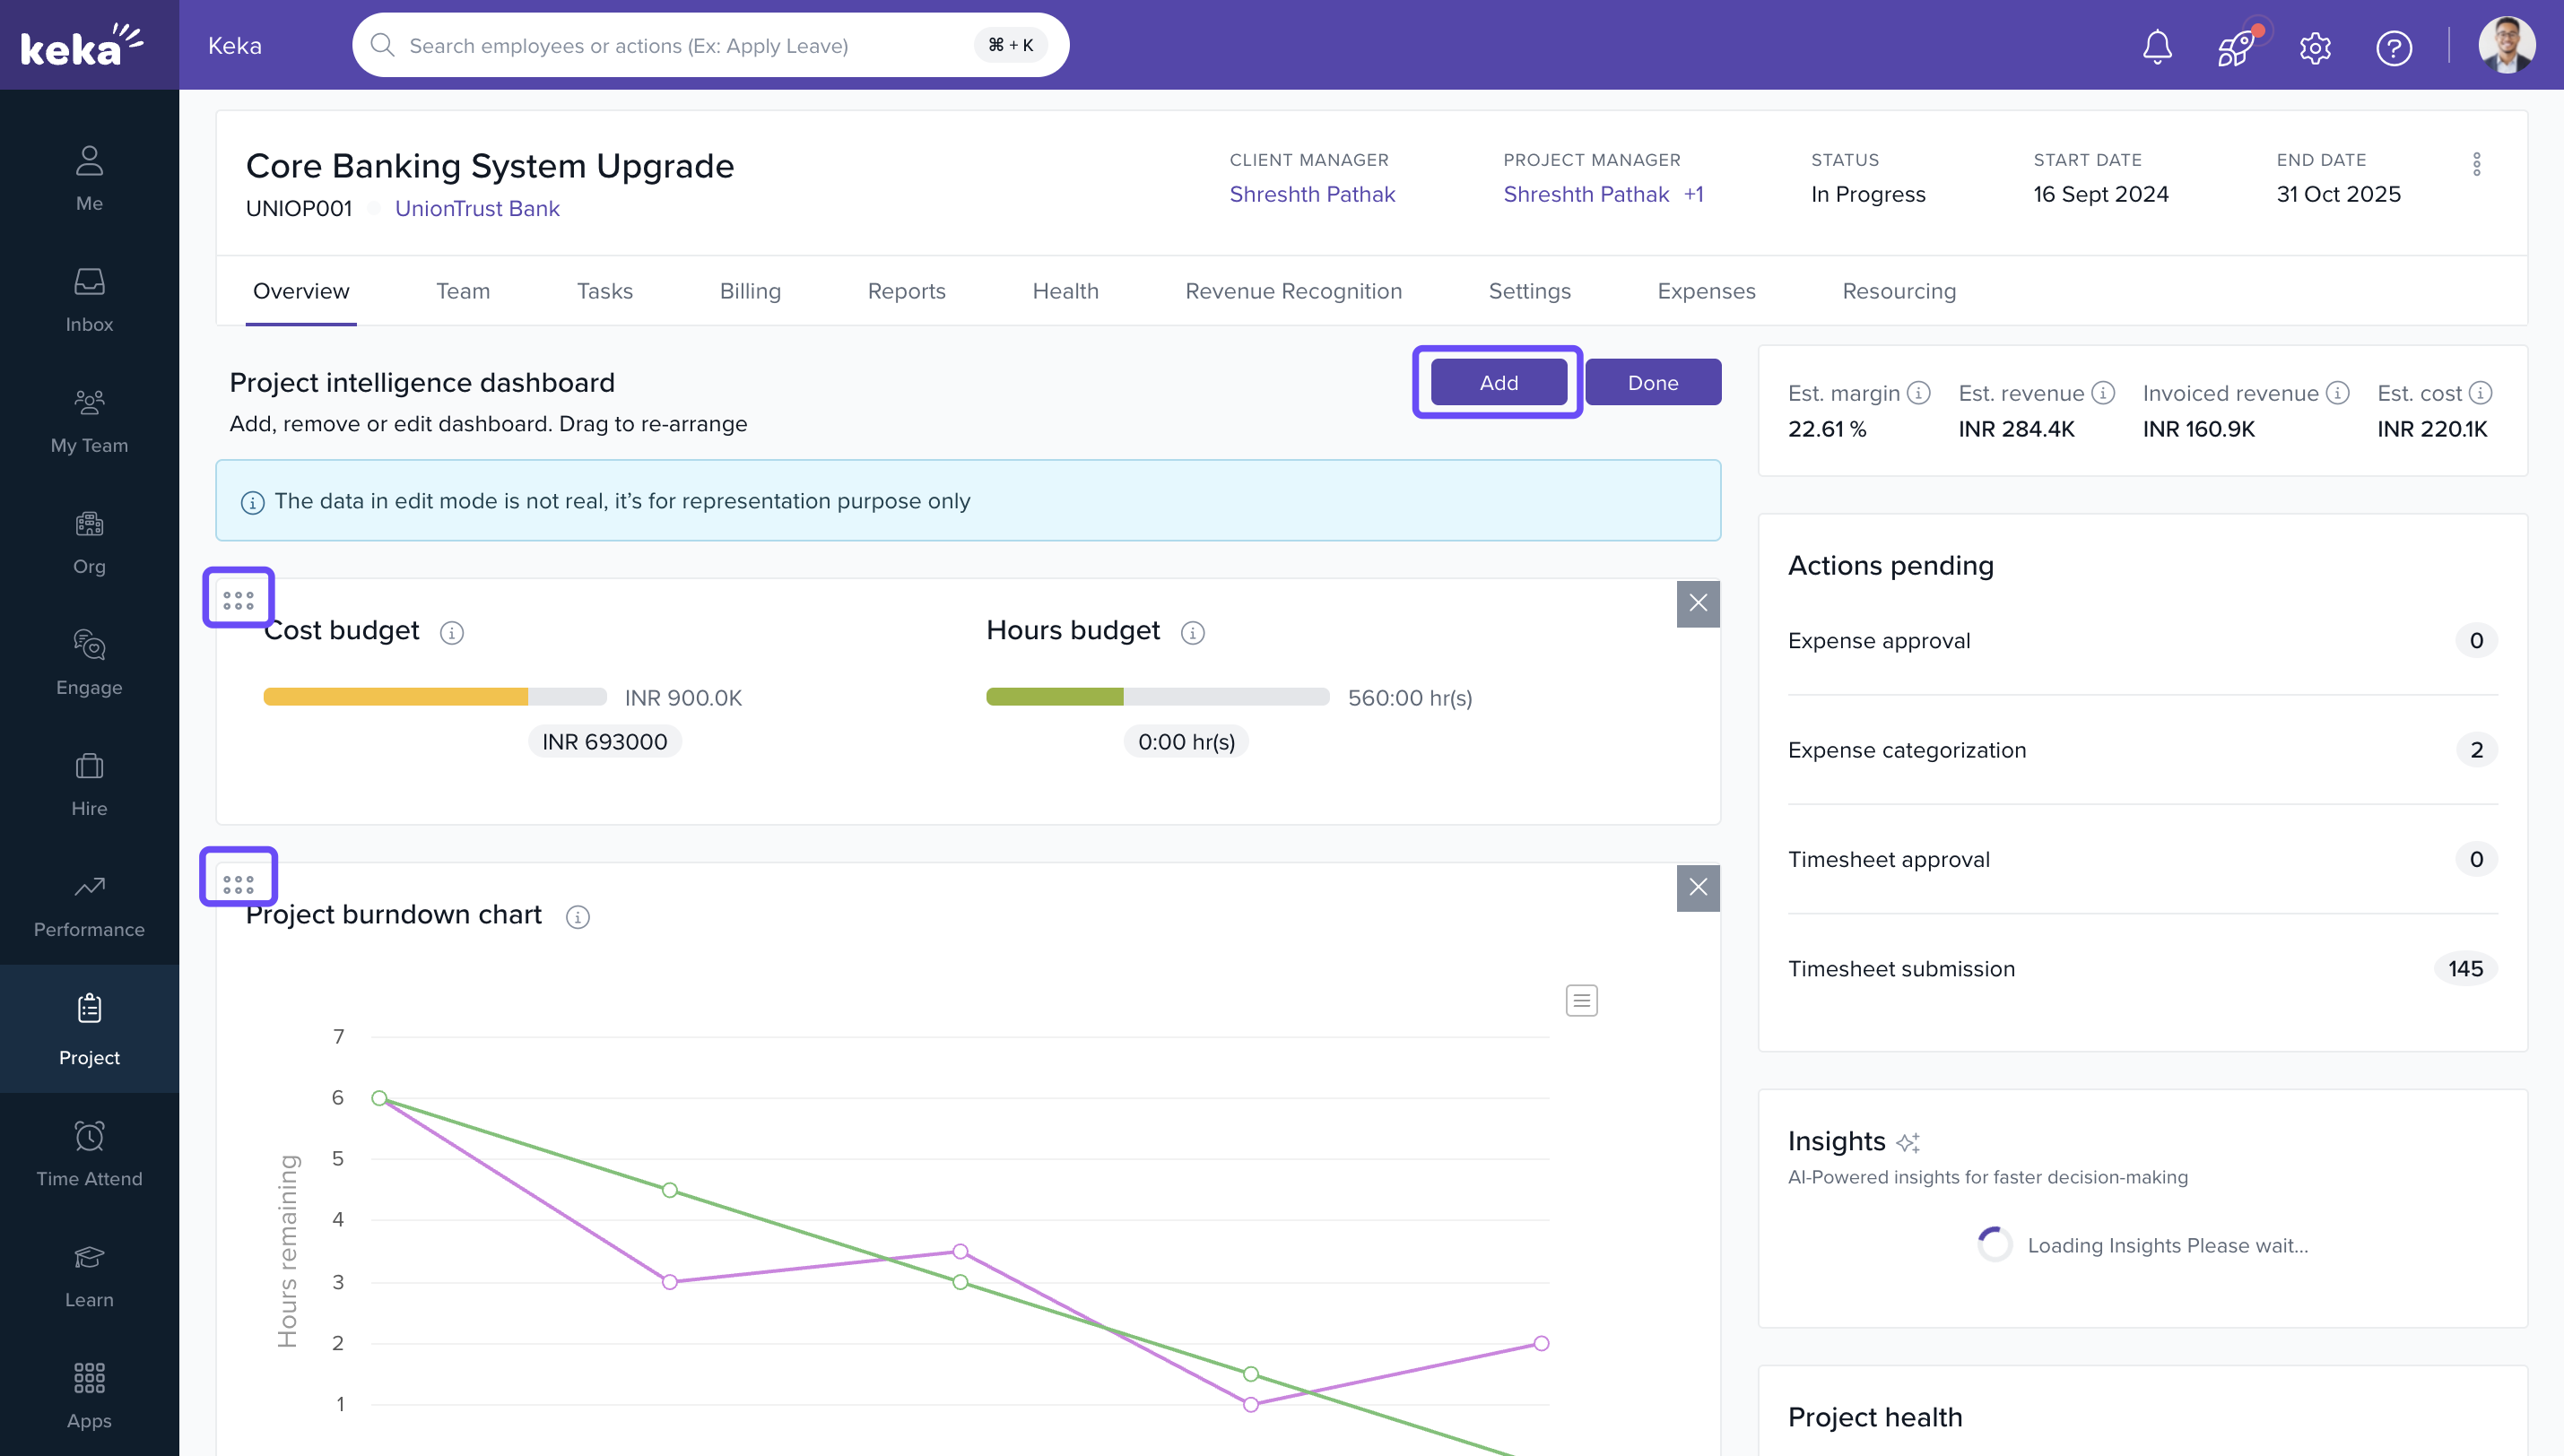
- Click Save to retain your layout changes.
Using Filters and Export Data
- Use the Date Range filter to analyze specific timeframes.
- Click Export to download chart data for offline analysis.
Analysing Project Widgets
-
Estimated Cost (Est Cost)
- Hourly Projects: Allocated Hours × Hourly Cost
- Fixed Projects: Allocated Days × (Annual Cost ÷ 365)
-
Estimated Revenue (Est Revenue)
- T&M: Approved Time × Bill Rate
- Fixed Fee / Milestone: Sum of Milestone Fees
- Retainer: Retainer Total for Project Duration
-
Estimated Margin (Est Margin)
- ((Est Revenue – Est Cost) ÷ Est Revenue) × 100
- Invoiced Revenue – Sum of All Invoices Raised to Date
- Hours Budget – Compares Approved Hours vs Budgeted Hours
- Cost Budget – Compares Incurred Cost to Date vs Budgeted Cost
- Pending Actions, Project Health, Employee Leave Status within the project team

Dashboard Update Frequency
The dashboard auto-refreshes once every 24 hours based on your first visit of the day.
Example: If visited at 4 PM today, the next update happens at 4 PM tomorrow.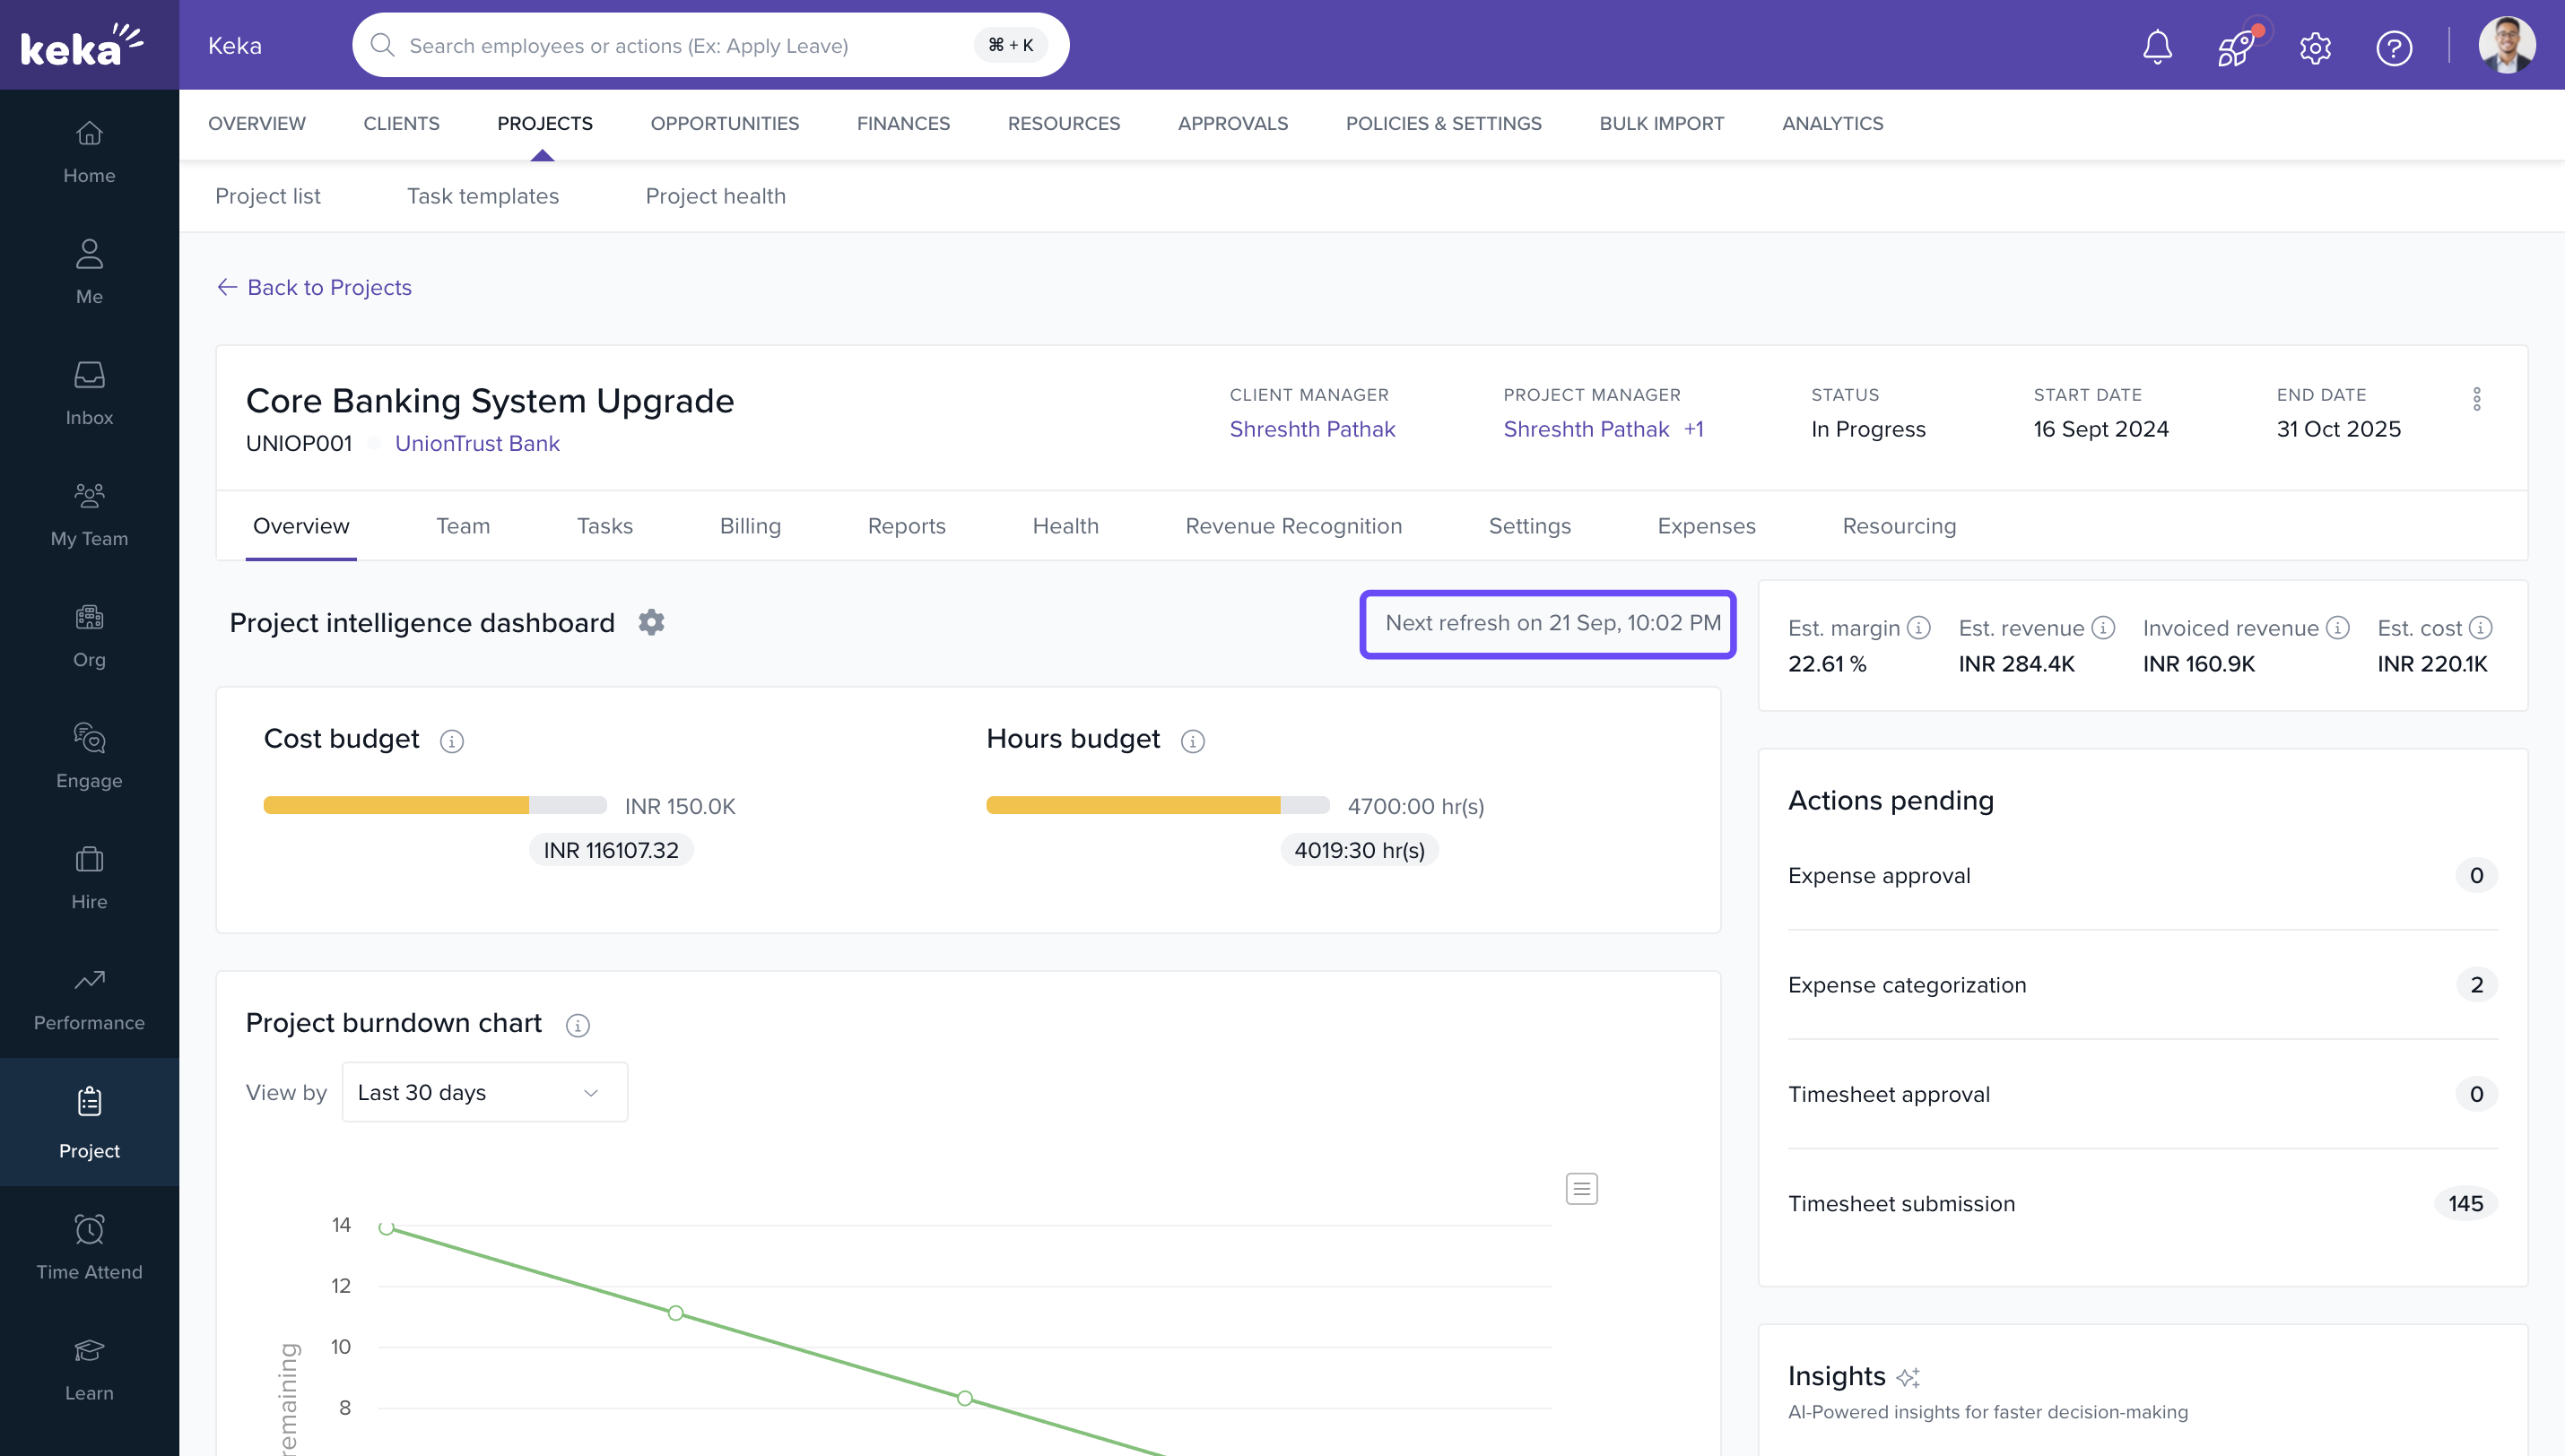
Setting Permissions
-
Default Access:
- PMs and Client Managers: Access to their own projects
- PSA Admins and Global Admins: Access to all projects
-
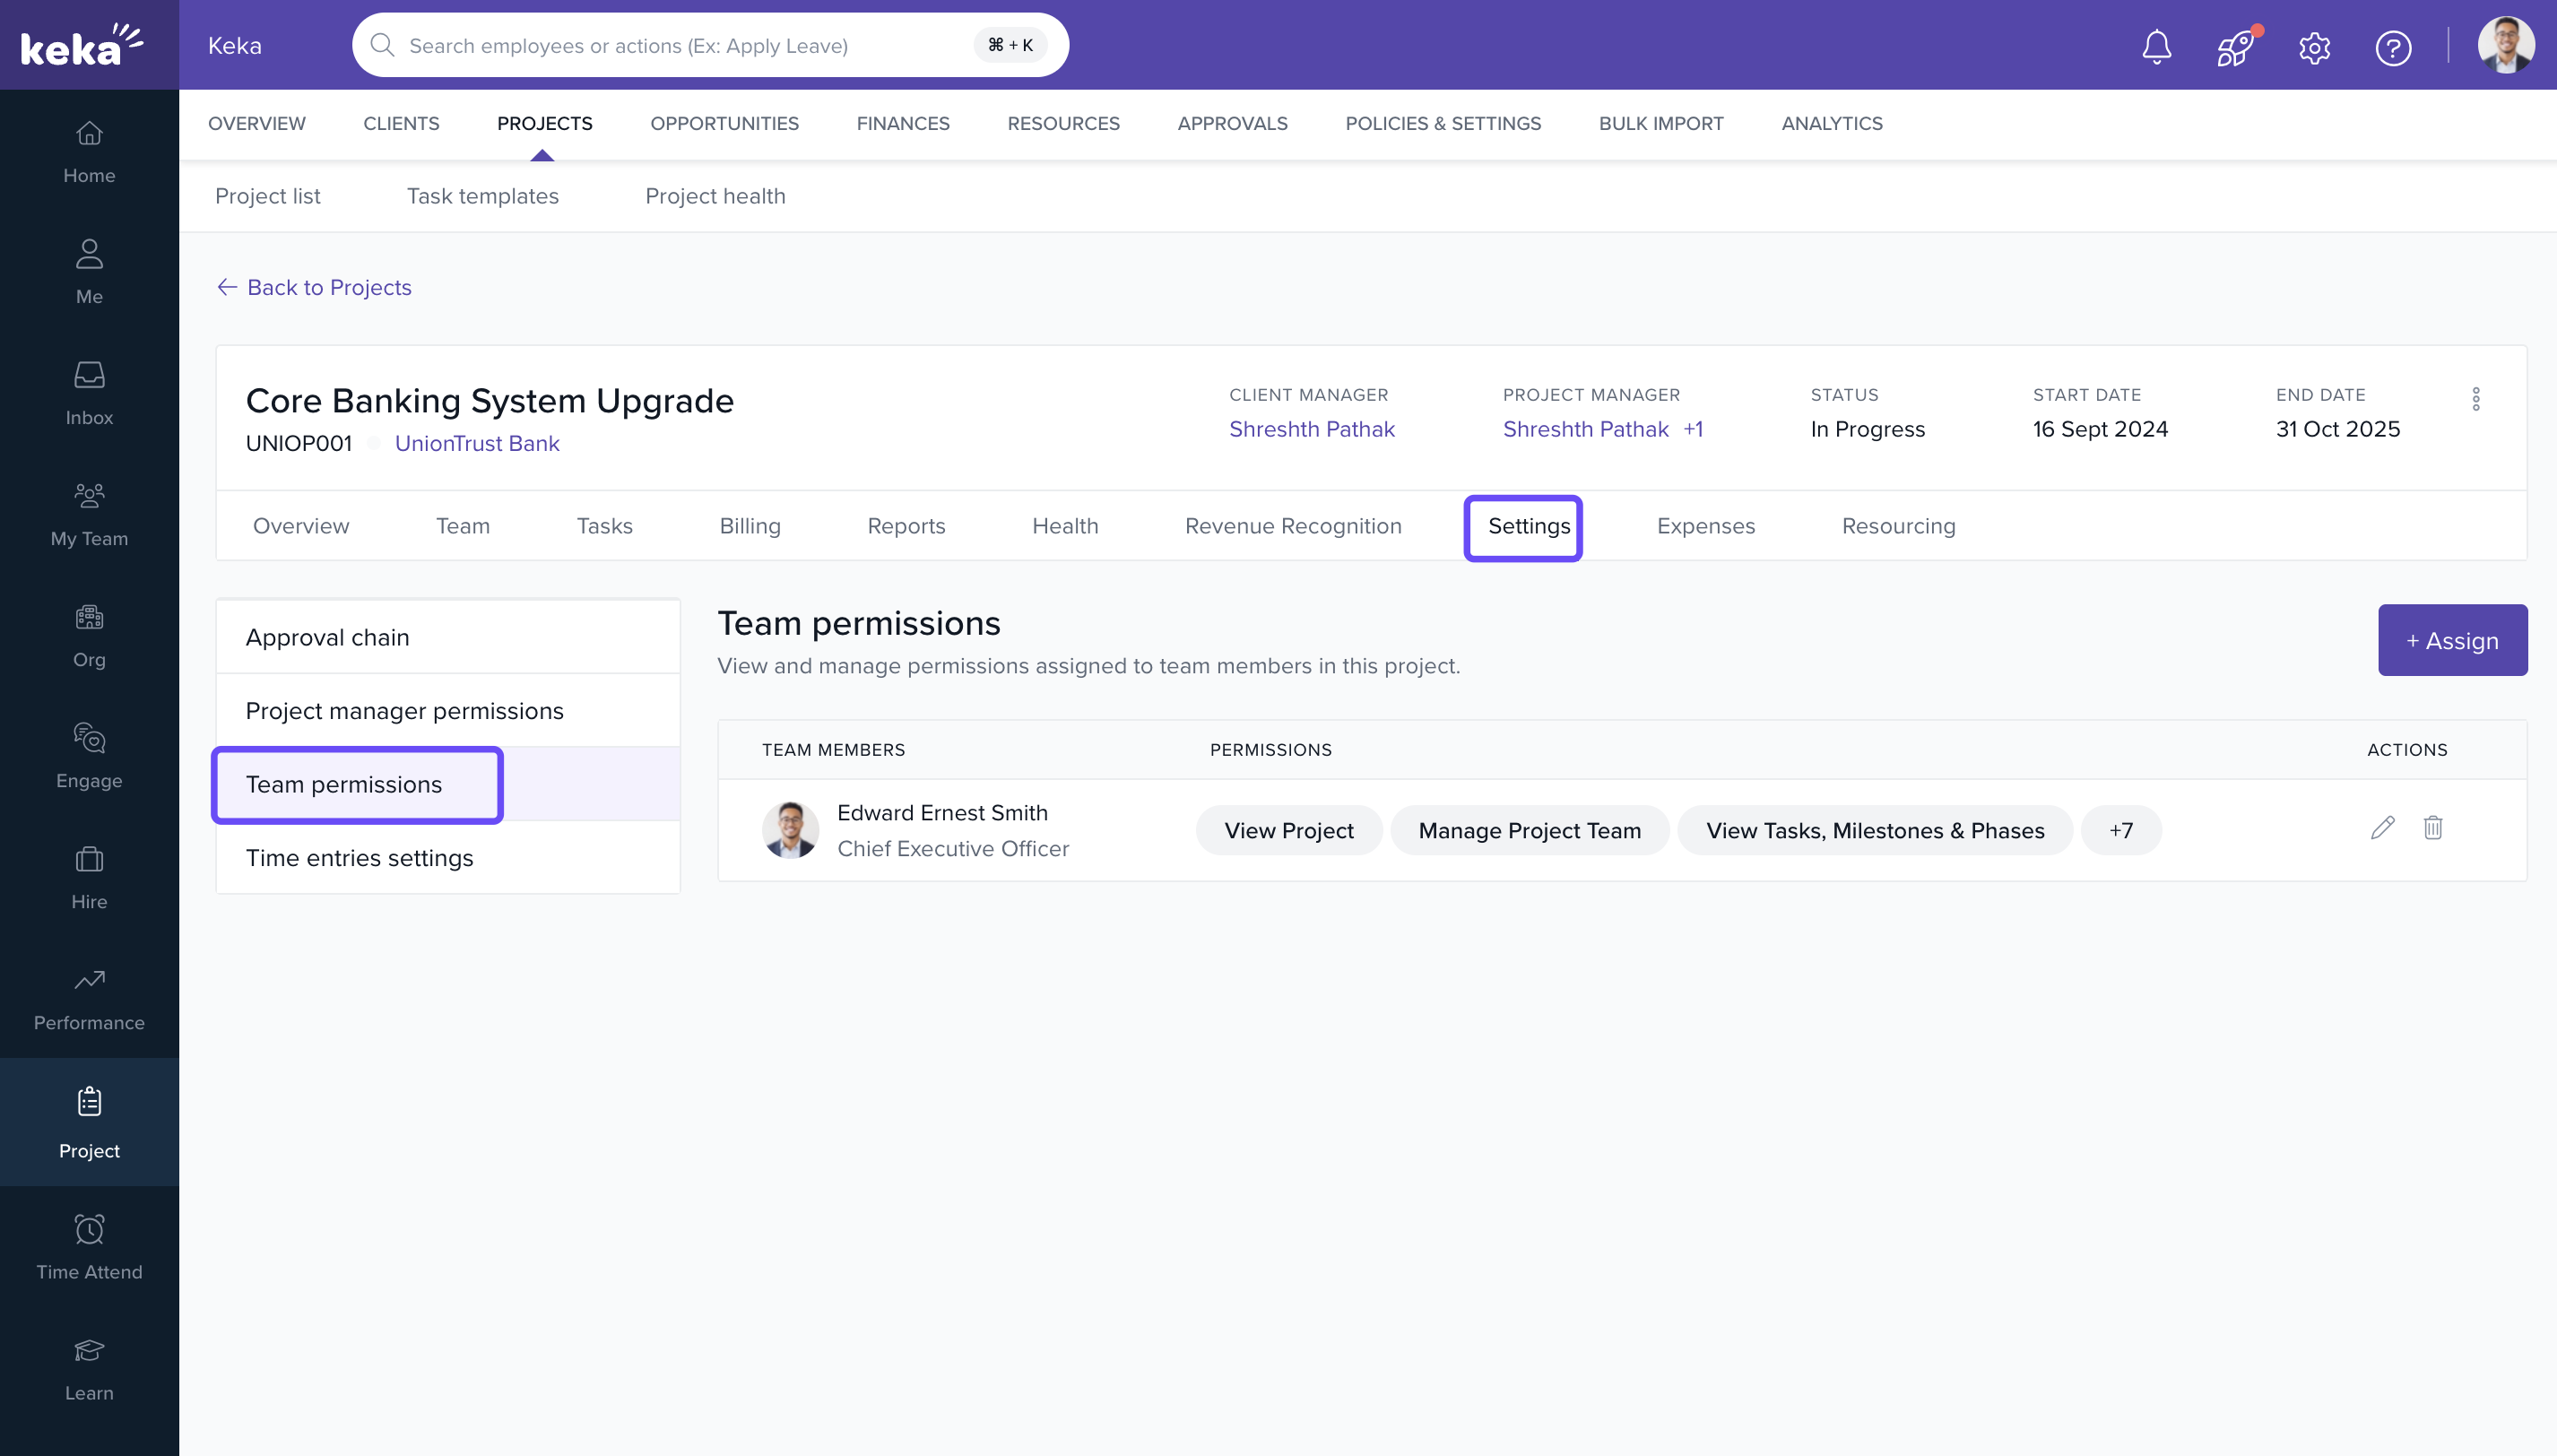
Custom Access:
- To grant dashboard access: Go to Project Settings > Permissions
- Assign: View Project, View Financials
-
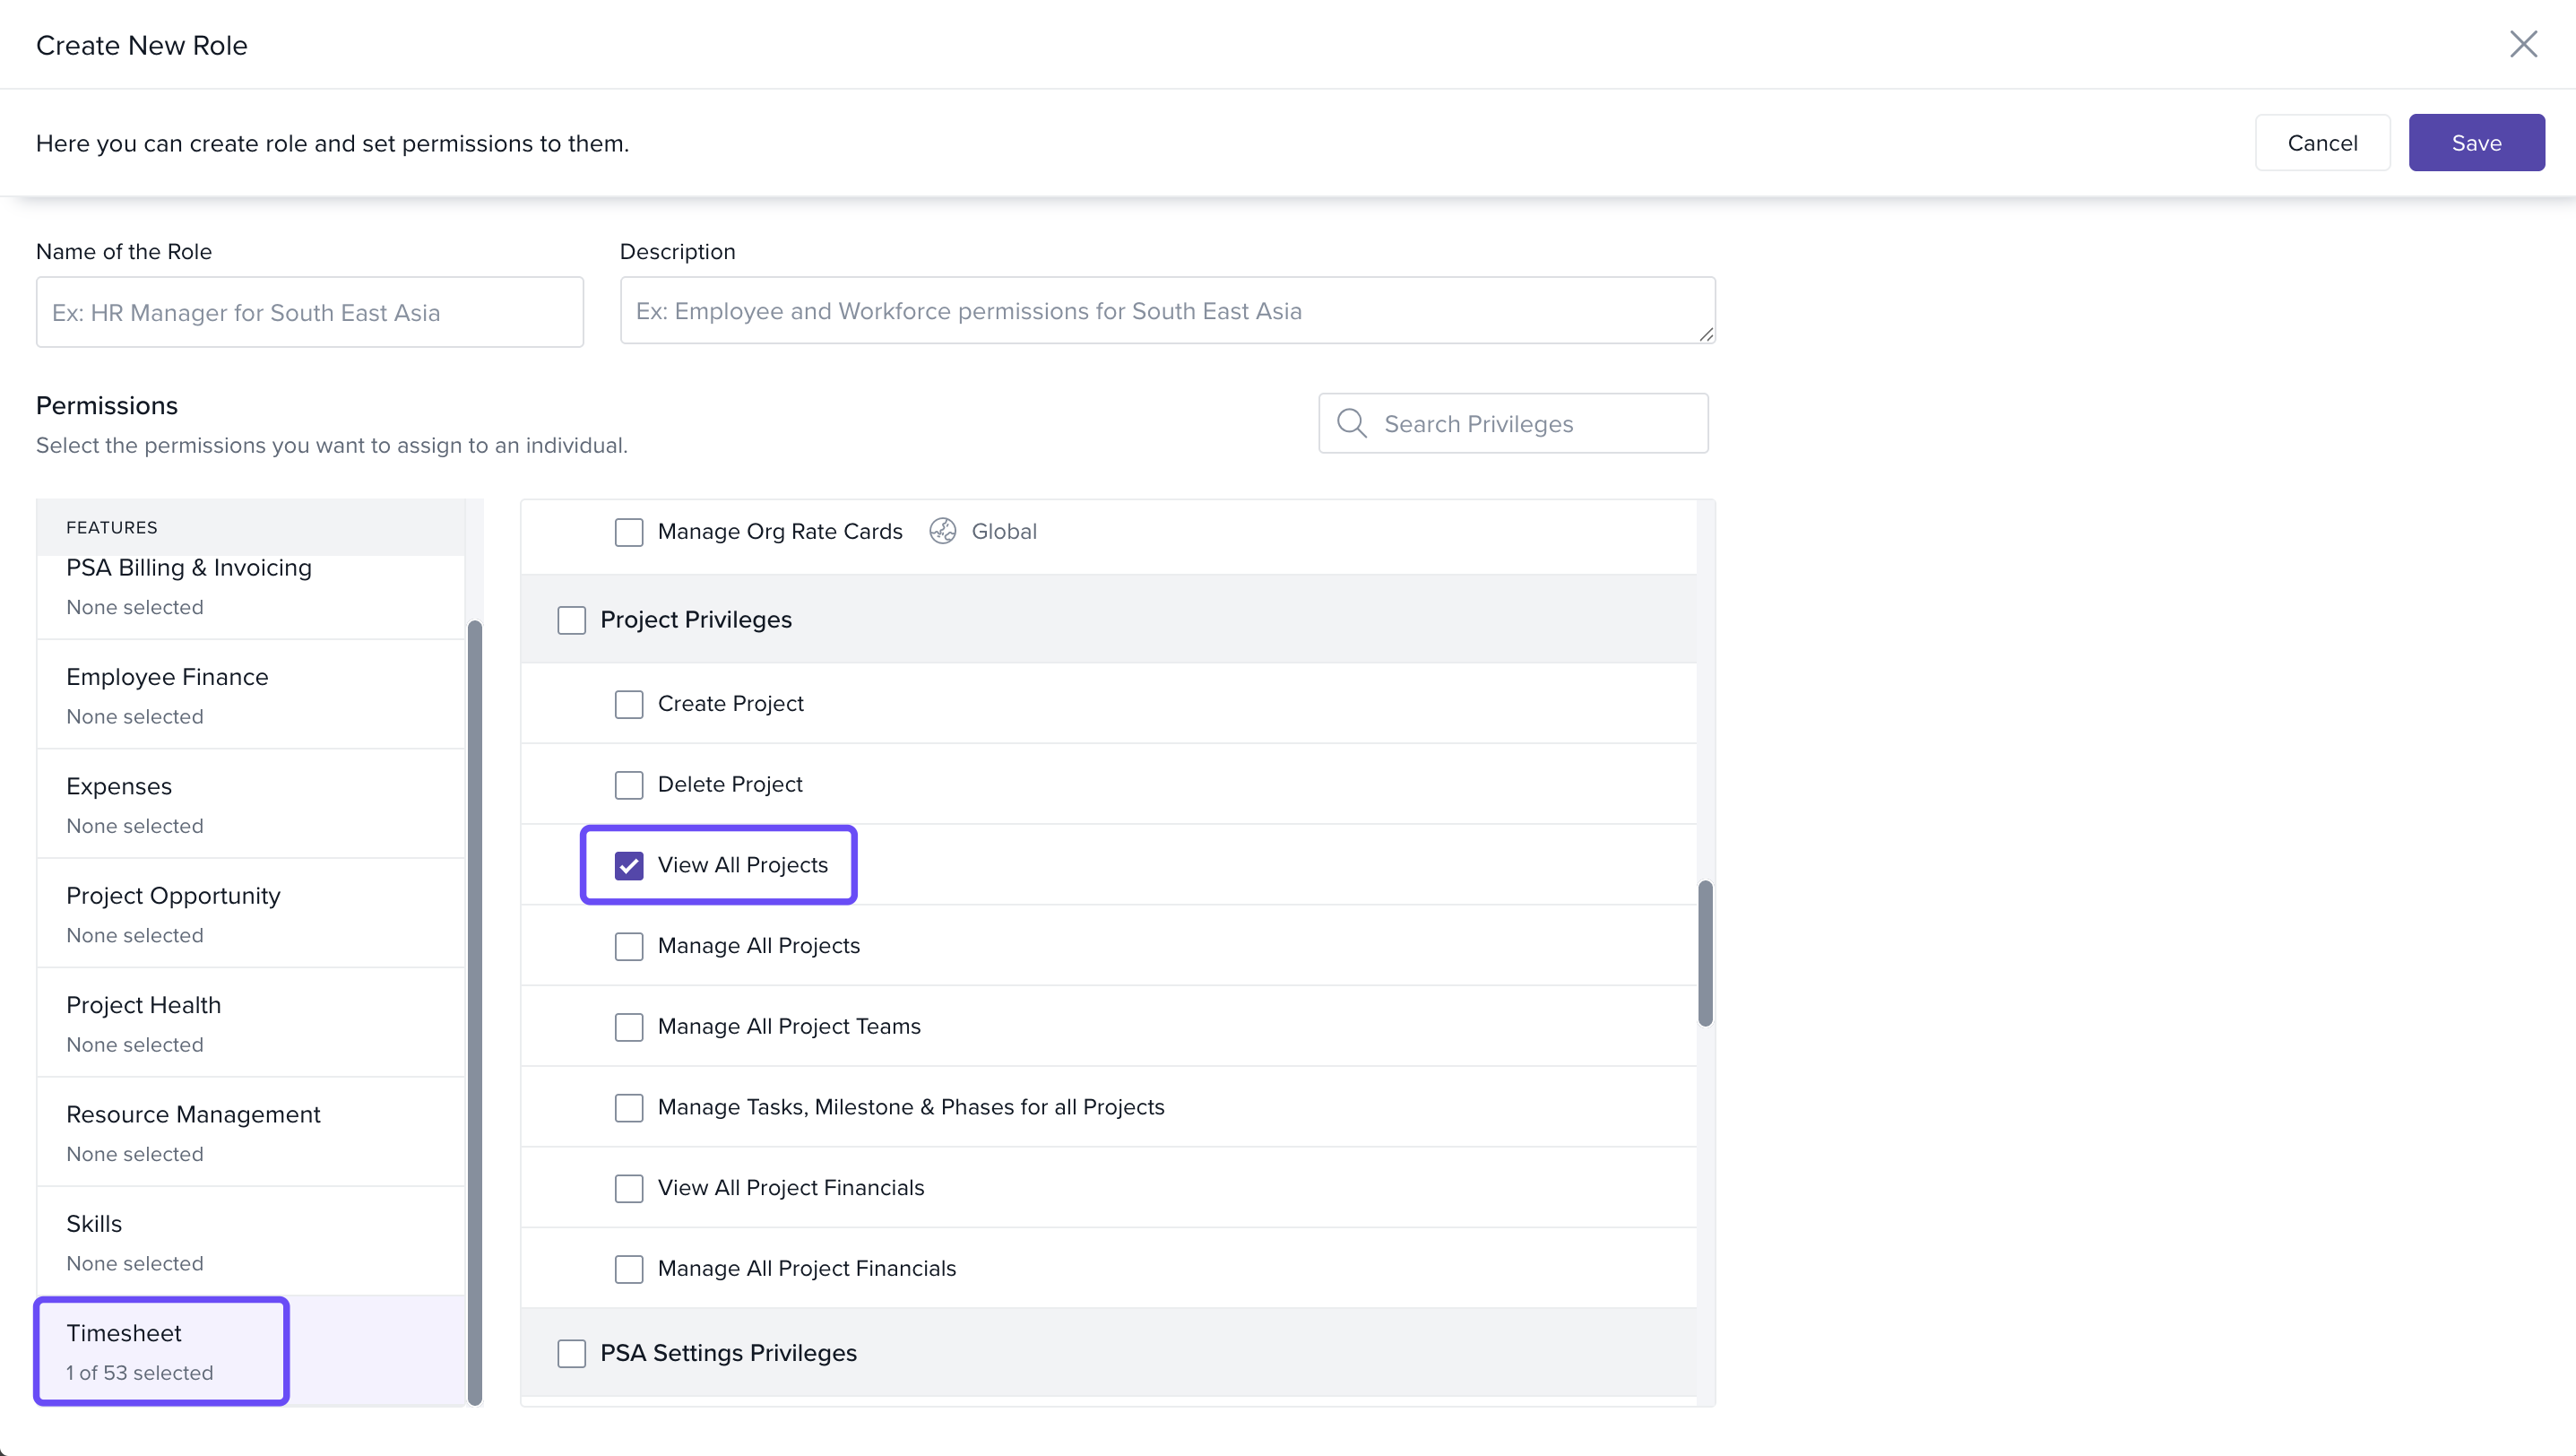
Global Access:
- Go to Roles & Permissions (Global Settings)
- Assign Timesheet-related access, including: View All Projects, View Financials
FAQs
Q: Can I export charts from the dashboard?
A: Yes, each chart has an export option for offline use.
Q: Can I track both cost and revenue?
A: Yes, charts and widgets include comparisons of planned vs actual for cost, revenue, and margins.
Q: Can I edit widgets or KPIs?
A: No. Widgets are auto-calculated based on your project setup and cannot be modified.
Q: Why don’t I see financial data?
A: You must have “View Financials” permission enabled.
Troubleshooting
Dashboard not visible?
- Ensure you have project access.
- Confirm role-based permission setup.
Missing charts?
- Click Settings > Add Charts manually.
- Charts may not appear if related project data is missing.
Incorrect financial data?
- Validate allocations and timesheet submissions.
- Confirm billing models and project types are set correctly.
Comments
0 comments
Please sign in to leave a comment.