Attrition data often sits in static charts and reports, making it difficult for HR teams to interpret patterns quickly. The Attrition Storyboard Dashboard transforms exit data into a visual narrative that highlights trends, clusters, and potential risk areas across the organization.
With AI-powered storyboards in Keka, HR teams can explore attrition trends across departments, roles, locations, gender, tenure, and time periods. Instead of reviewing raw numbers, teams see contextual insights that help them move from observation to action.
This feature is designed to simplify workforce analytics and enable data-driven decision-making without requiring advanced data expertise.
What’s new?
The Attrition Storyboard Dashboard presents exit data as:
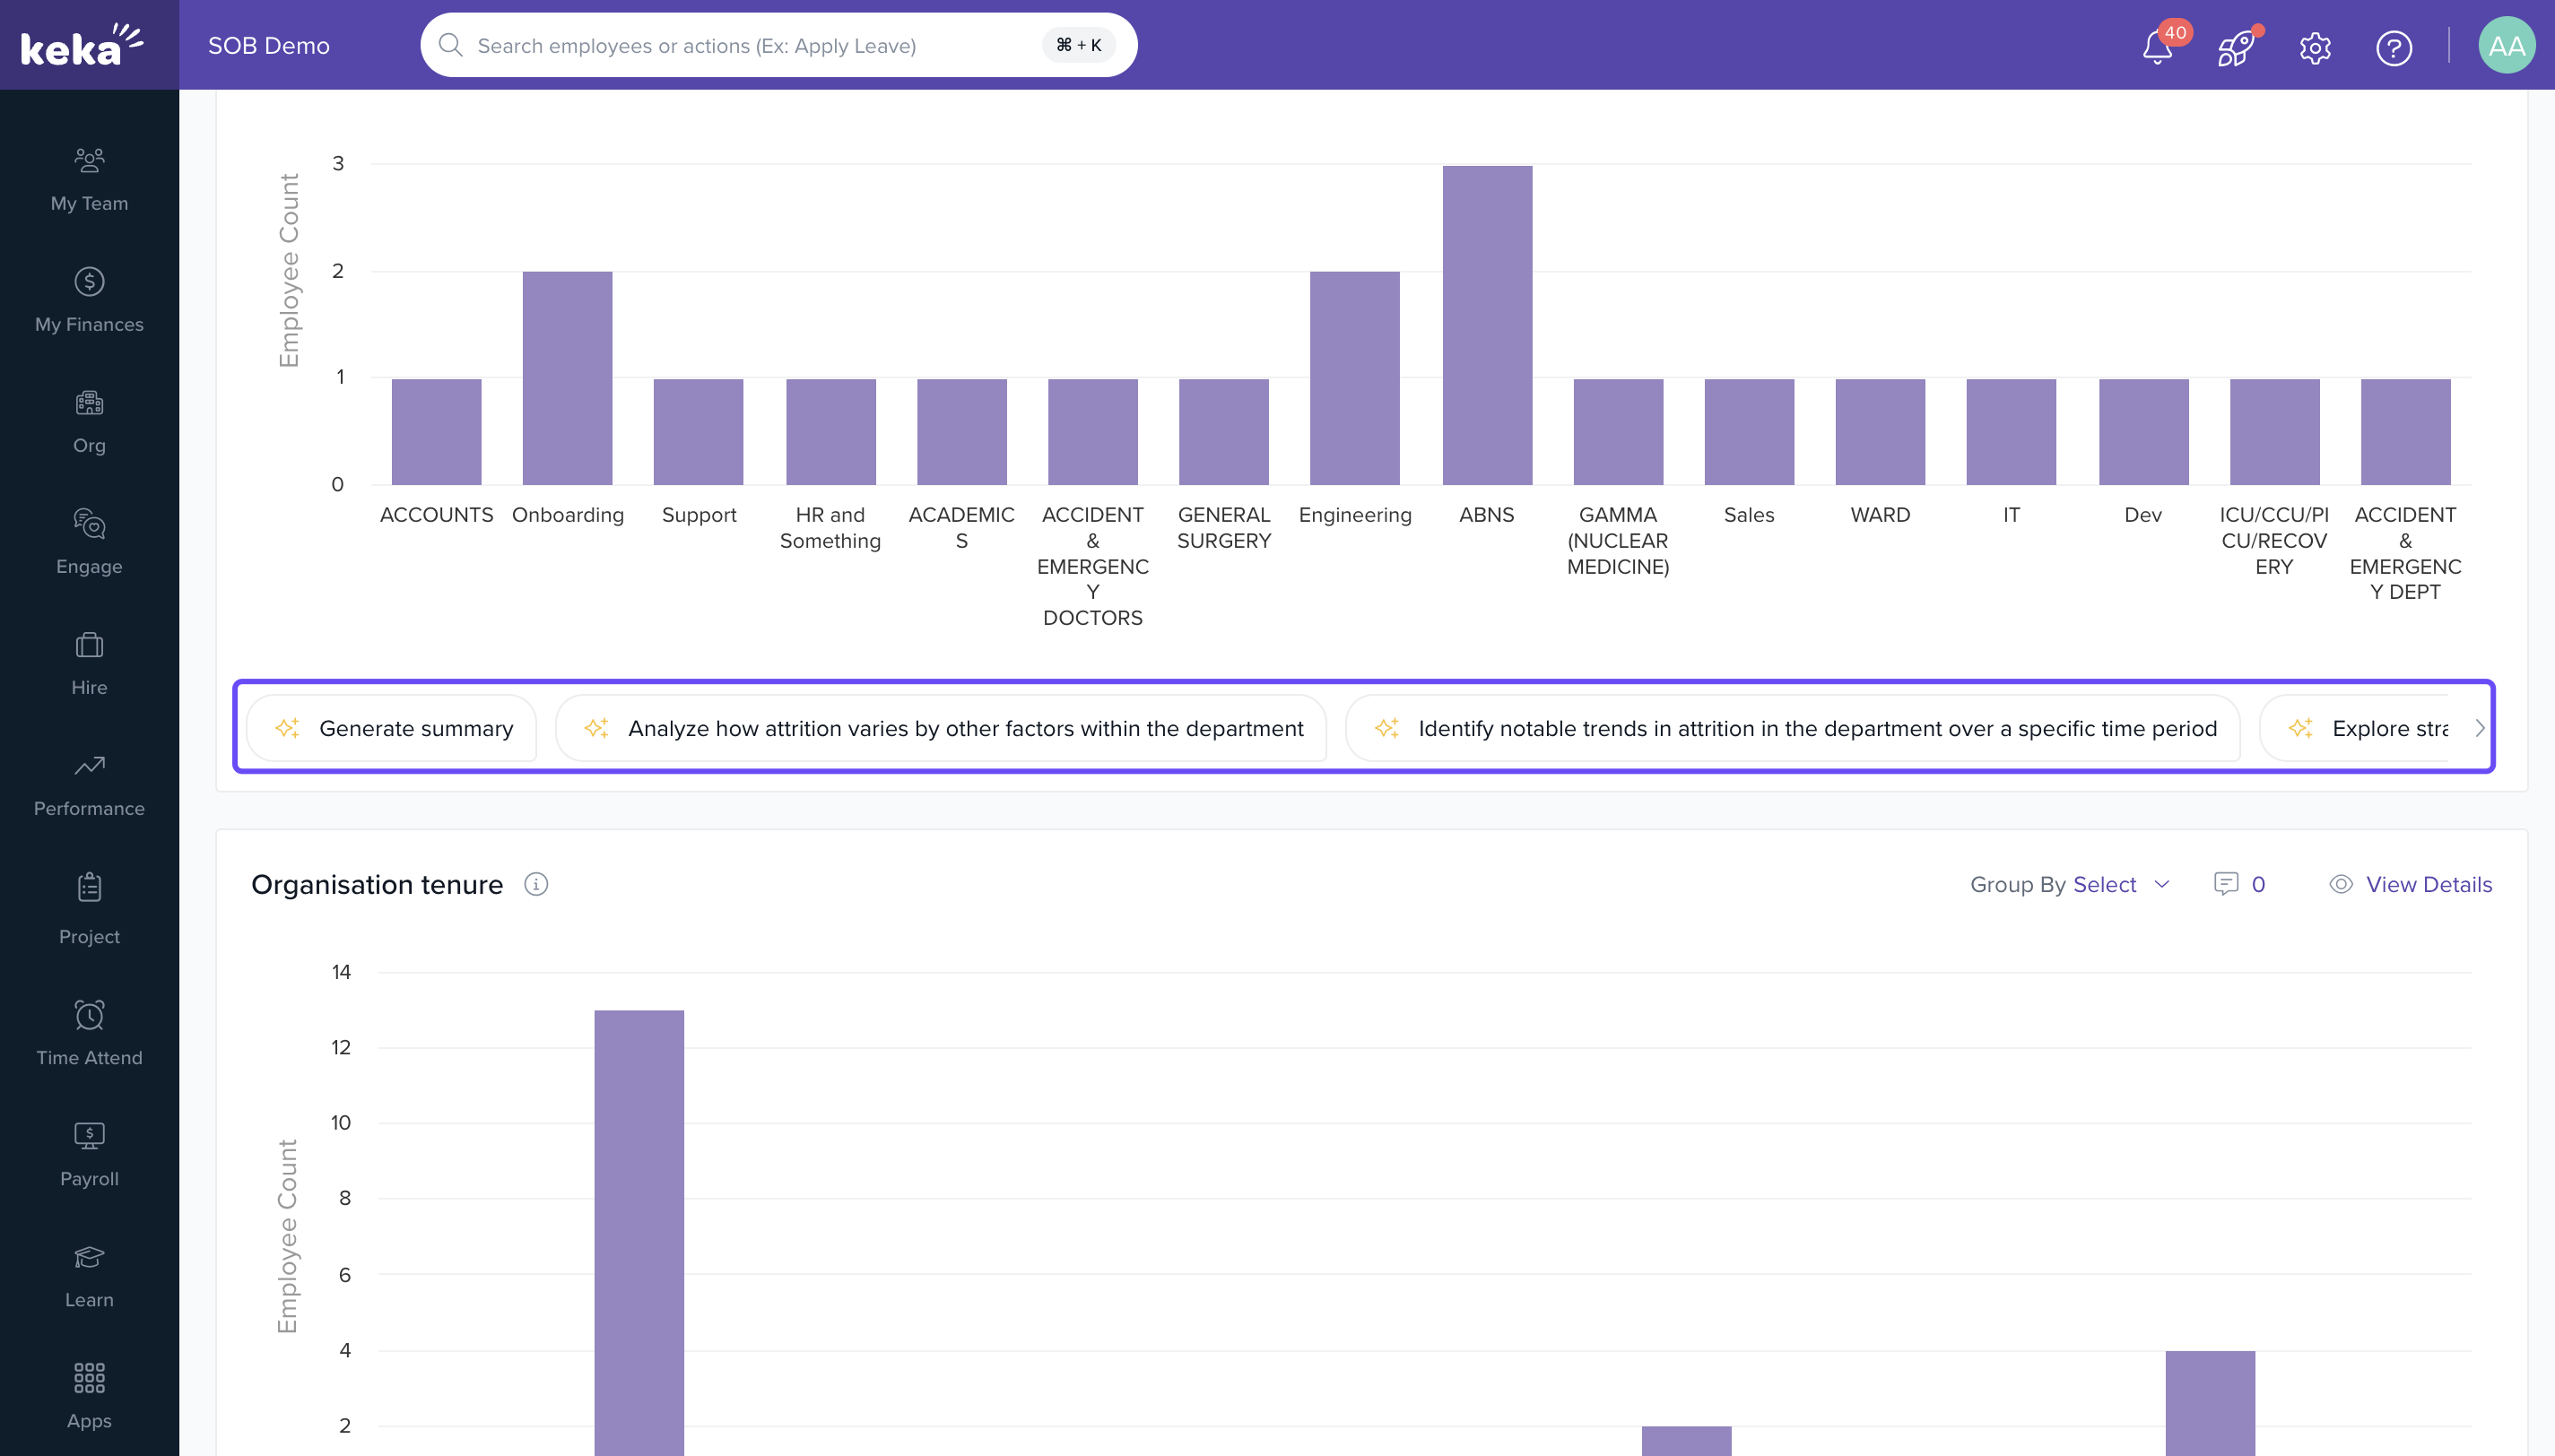
- A structured, visual narrative instead of static charts
- AI-driven insights that highlight emerging patterns
- Drilldowns across multiple workforce parameters
- Collaborative storyboards for aligned decision-making
The storyboard approach clearly shows where attrition is:
- Rising
- Stabilizing
- Clustering within specific groups
This helps HR teams proactively address retention risks.
Key features
AI-powered drilldown
Predefined AI prompts
Real-time collaboration
Easy data sharing
Data filtering
Benefits
Quick insights without data expertise
Consistency across teams
Streamlined decision-making
Efficient trend analysis
Increased operational efficiency
The Attrition Storyboard Dashboard turns workforce exits into meaningful insights, enabling HR teams to act with clarity and confidence.
Comments
0 comments
Please sign in to leave a comment.