Overview
Continuous Feedback Summary gives you a bird’s‑eye view of all feedback activity across your organisation in Keka. It’s intended for Performance Admins, HR Managers, or team leads who want to monitor recognition, constructive feedback, and engagement.
Navigating the Summary Tab
Go to the Performance section in Keka.
Click on Continuous Feedback.
-
Select the Summary tab.

-
On the Summary tab, you'll see charts and graphs showing praise and feedback metrics across date ranges and departments. You’ll also have filters to narrow down the data by Department and Date Range.

- You must have admin or manager rights to access performance analytics and feedback sections.
- The feature covers Praise, Feedback, Internal Notes, and Feedback Requests given/received via Keka’s Continuous Feedback module.
Key Dashboard Components
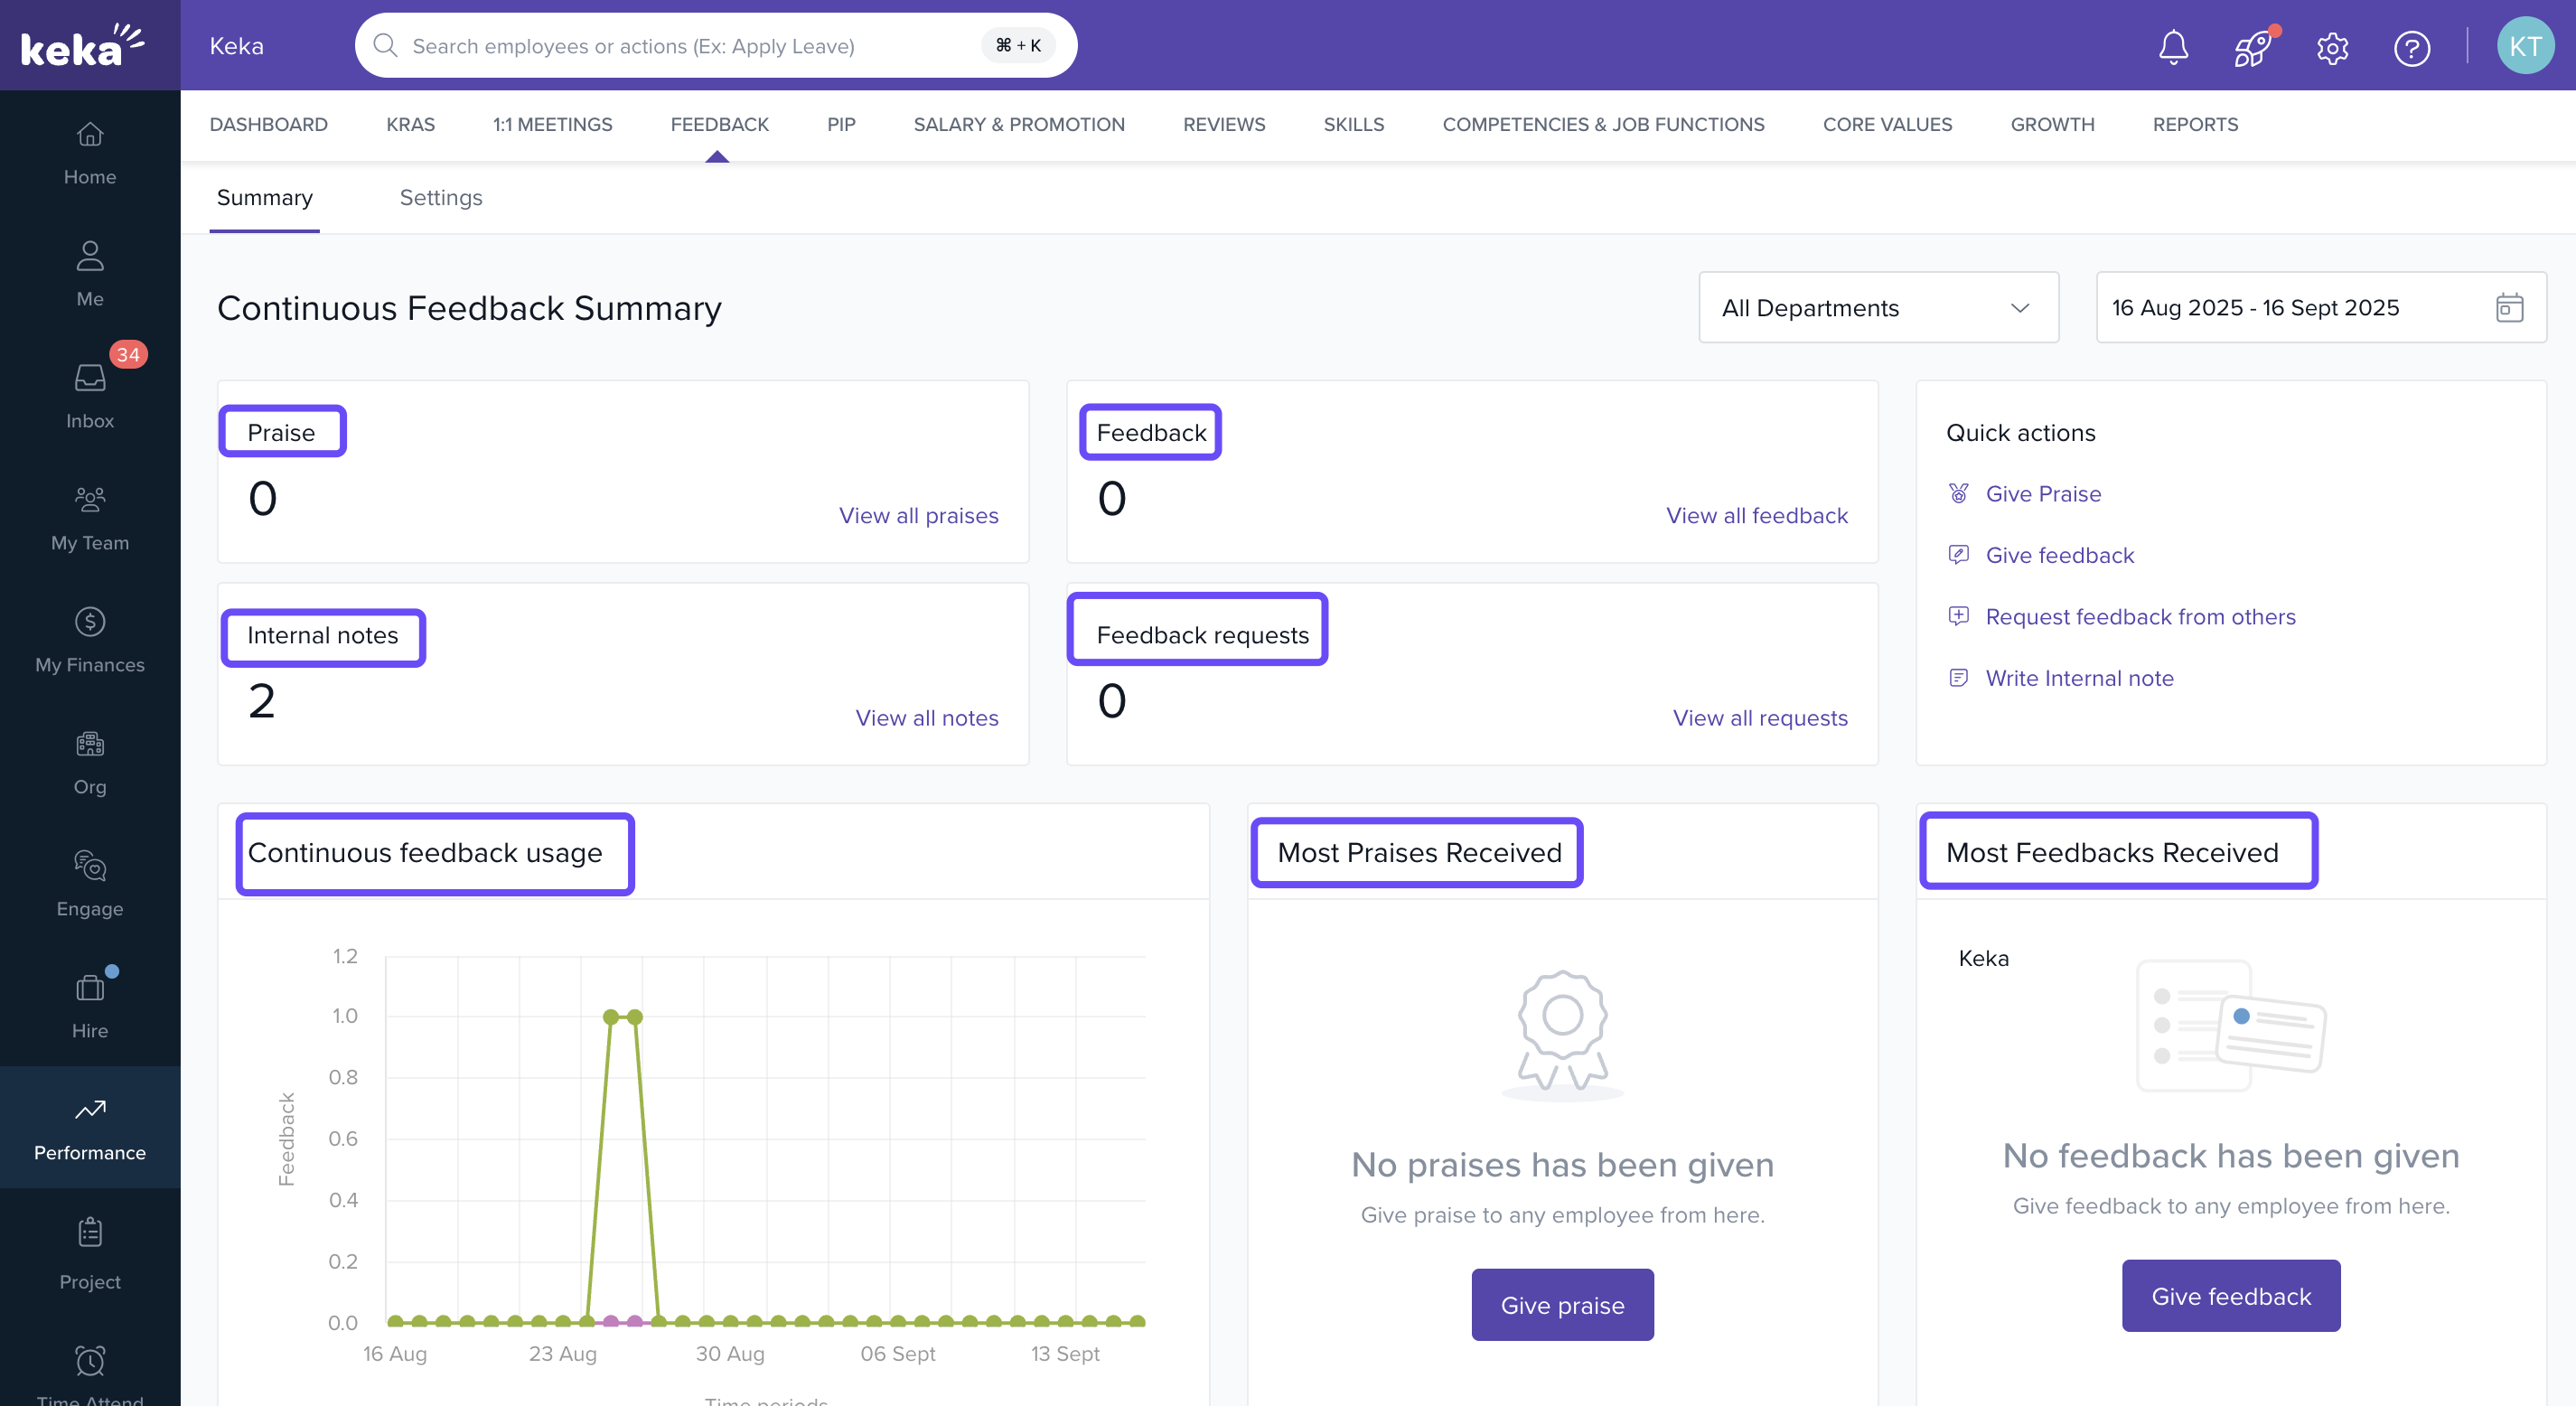
Once you're on the Summary tab, you'll find several metrics and insights that help you understand how feedback is flowing across the organisation:
Praise: Shows the total number of accolades or praises employees have received. This helps you gauge overall morale and recognition culture.
Feedback: Displays how many constructive feedback messages were exchanged between individuals or teams. It reflects how open the culture is to sharing growth-oriented feedback.
Internal Notes: Counts the number of internal notes recorded, such as private manager observations or coaching points. These are useful for capturing context that’s not shared openly.
Feedback Requests: Indicates how many times employees have proactively asked for feedback. It’s a great indicator of a team’s growth mindset and willingness to improve.
Continuous Feedback Usage: Visualises trends over time, showing how frequently feedback is given and requested. This helps track engagement levels and adoption of the feedback culture.
-
Most Praises Received / Most Feedbacks Received: Highlights individuals or teams who have received the most praise or feedback. These are your high-engagement contributors or recognition leaders.
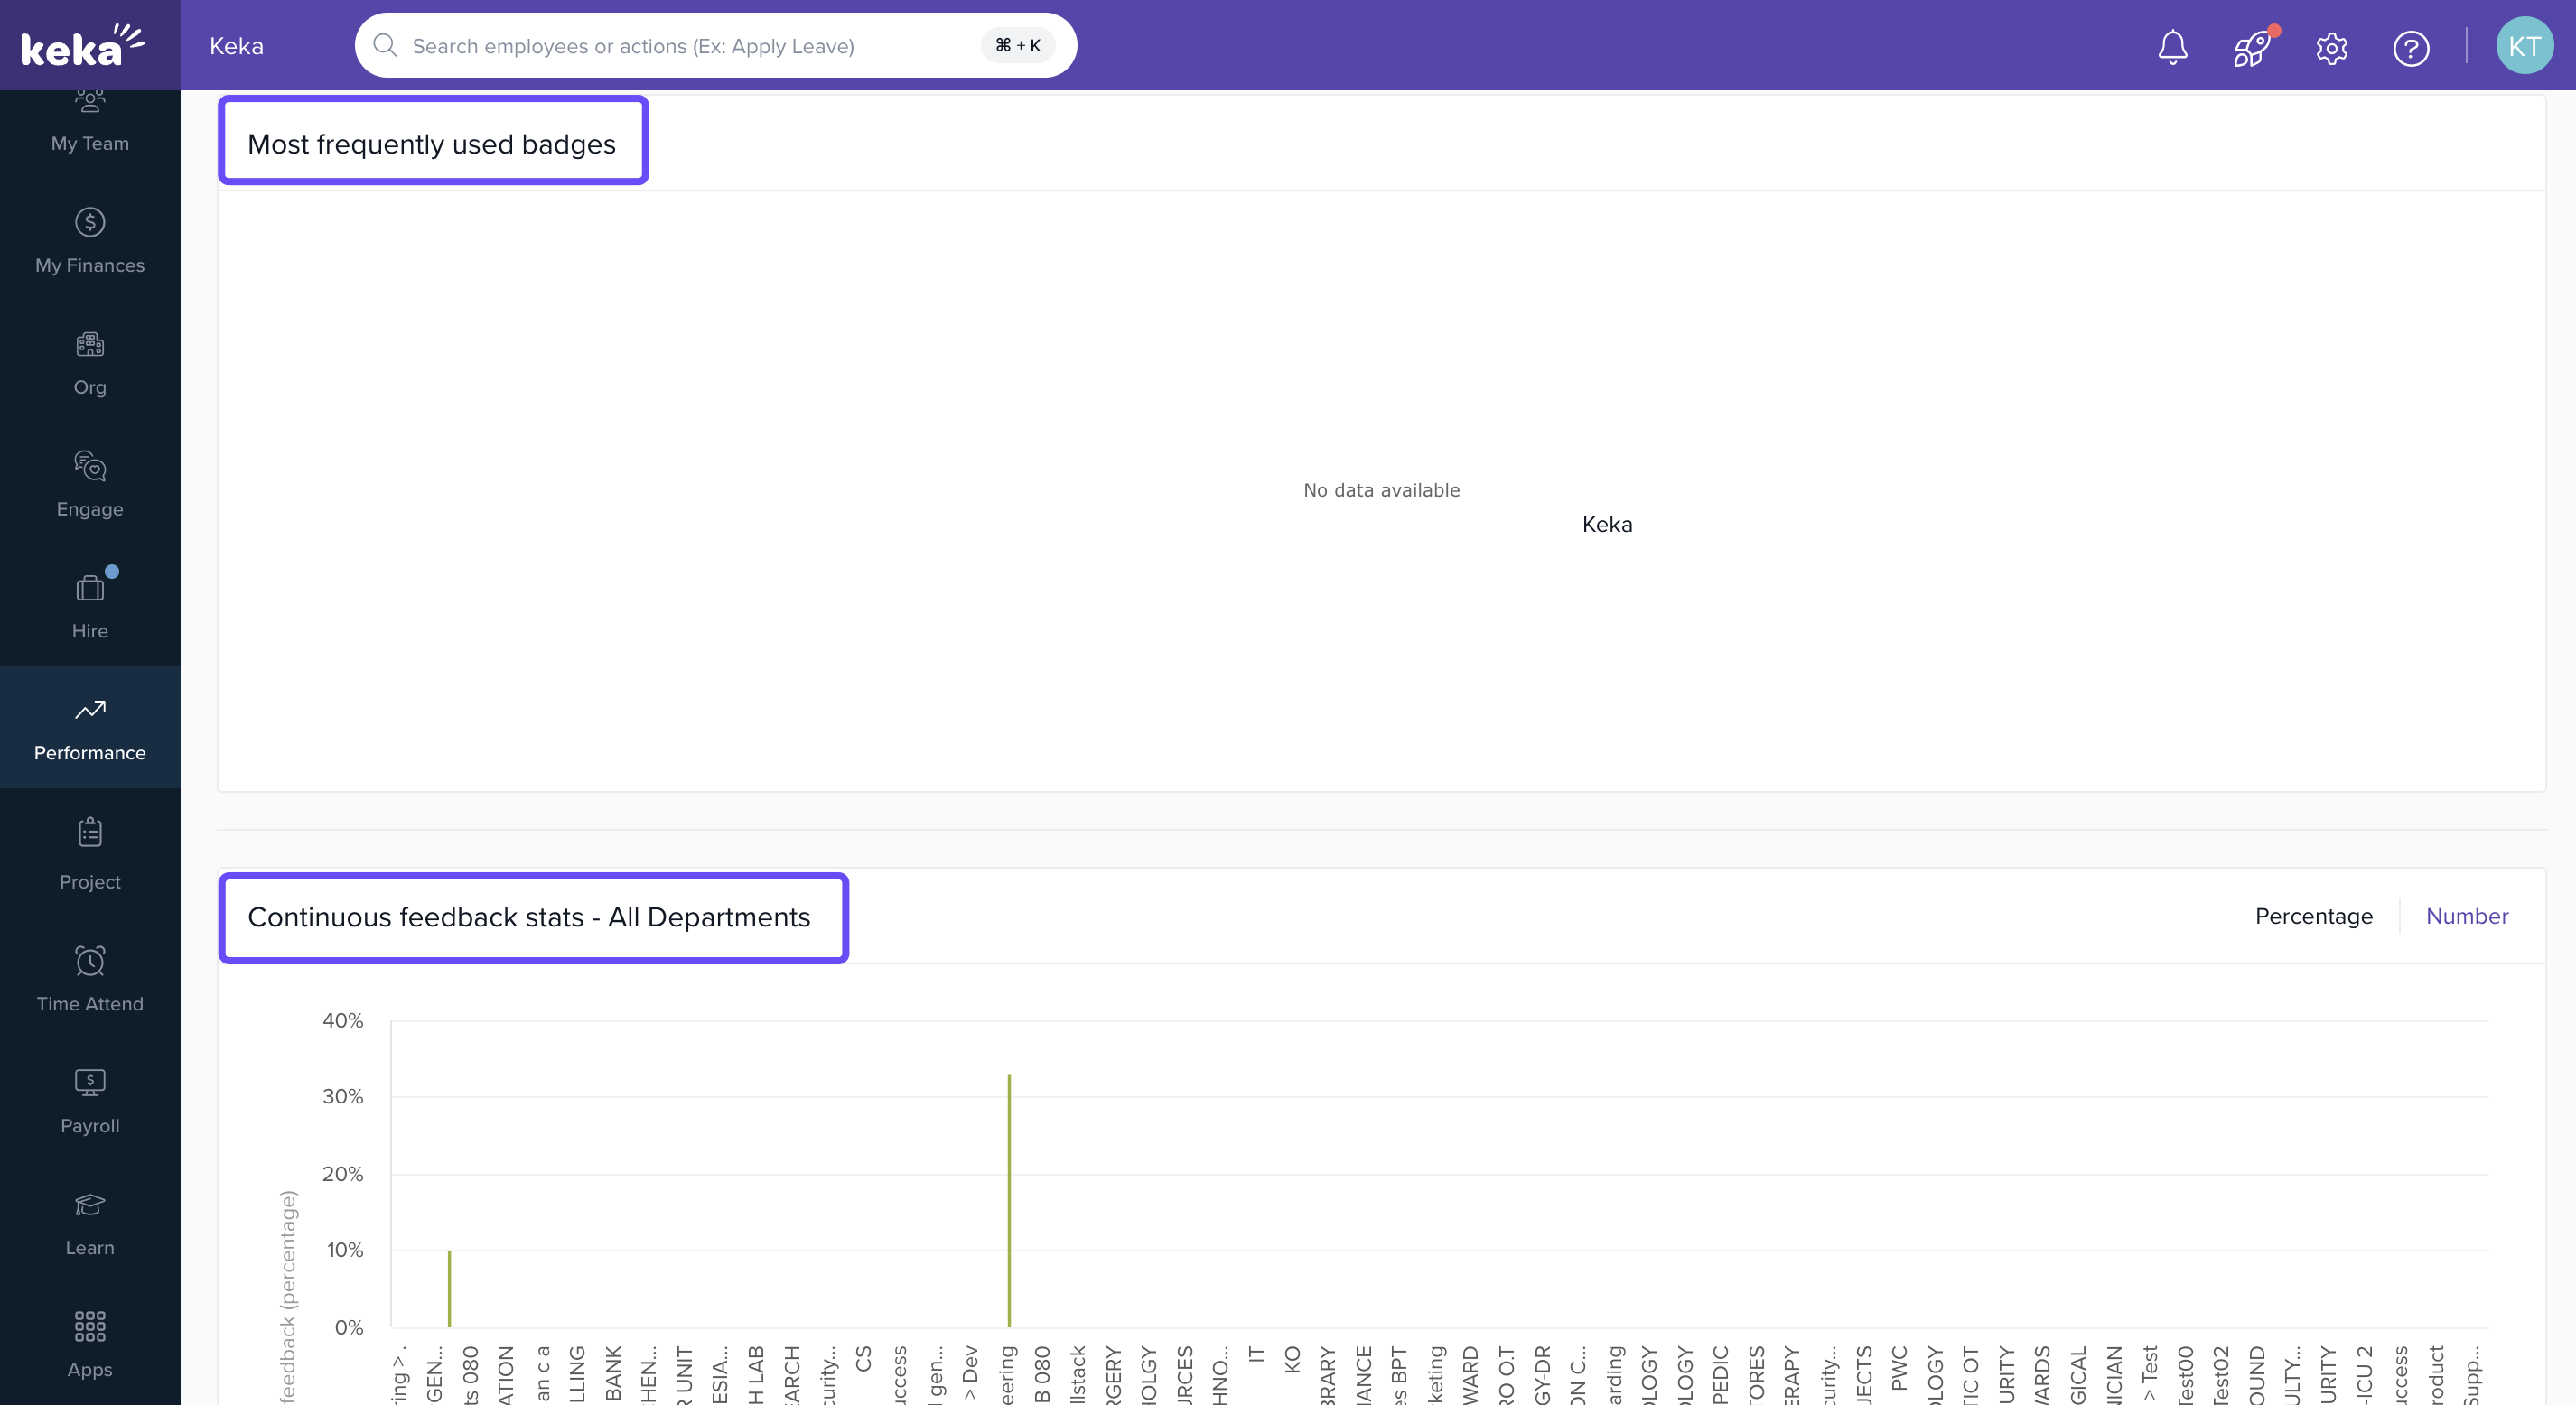
Most Frequently Used Badges: Shows which recognition badges are most commonly awarded. This insight can tell you what values or achievements your teams celebrate the most.
-
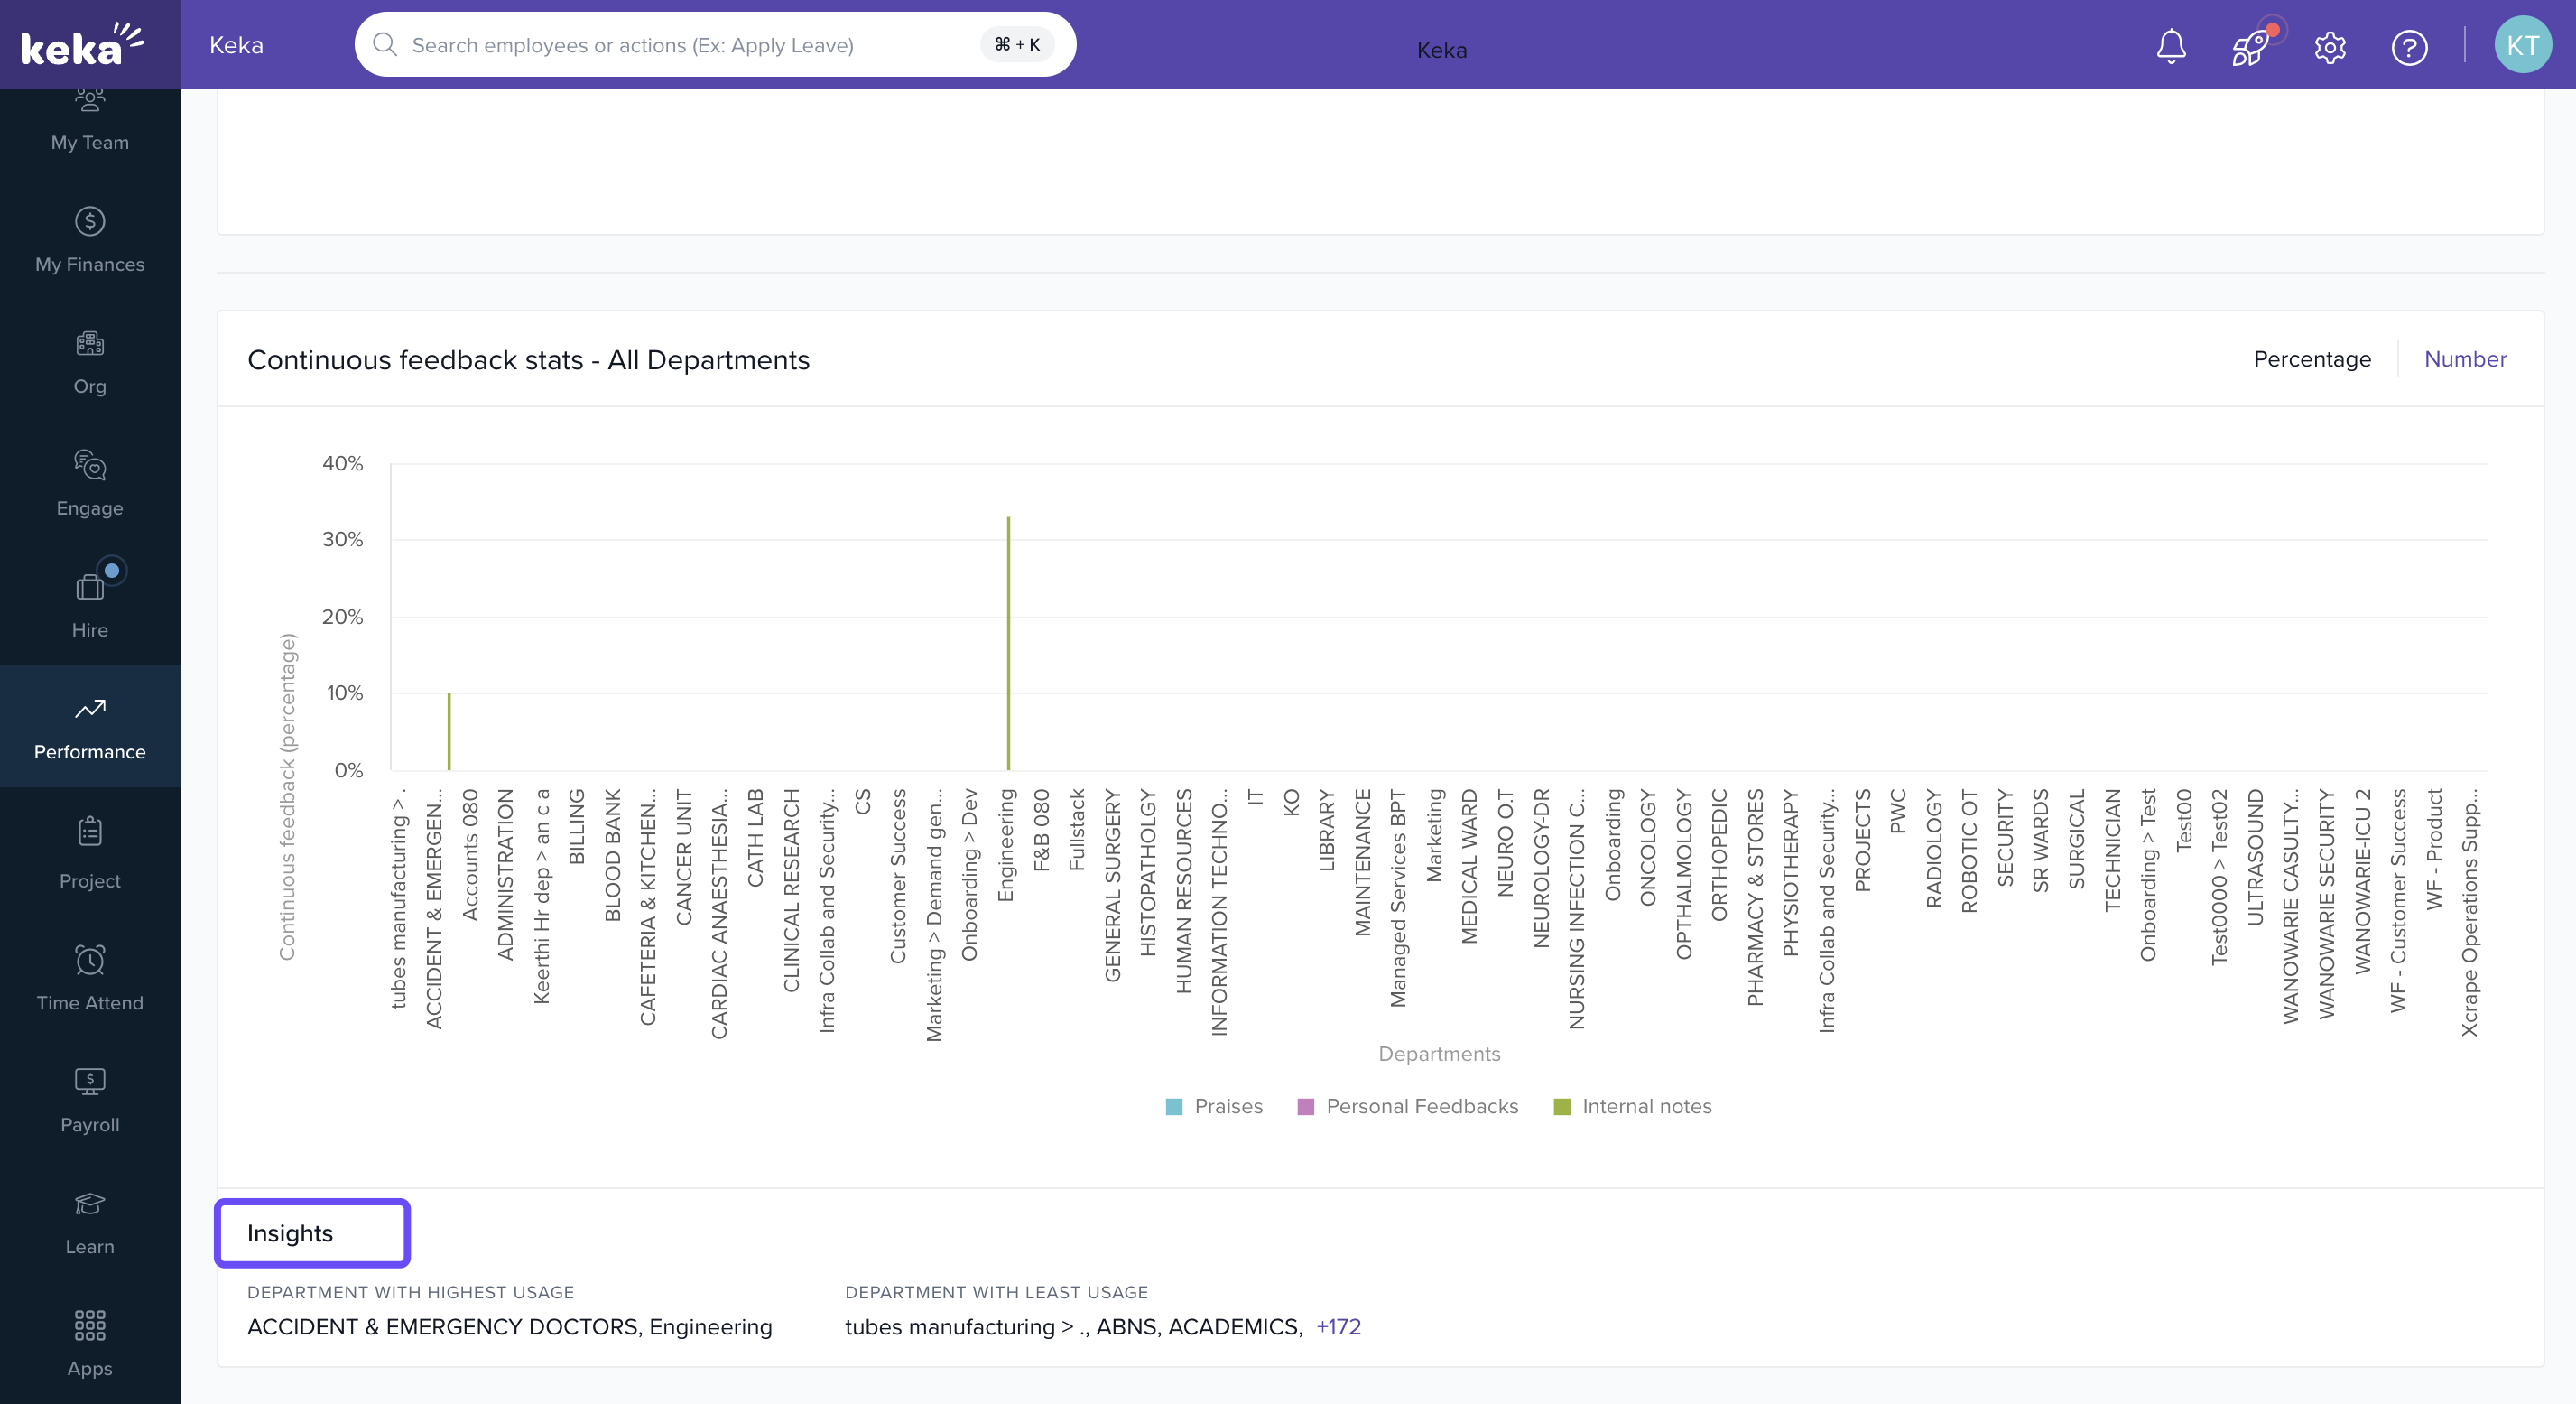
Continuous feedback stats: Examine department-specific engagement with continuous feedback graph. This analysis can help pinpoint areas of high engagement or departments that may require additional support in fostering a feedback-rich environment.
-
Insights: This part of the feedback page helps you understand how different departments are using the feedback system. It gives you a clear picture of which departments are talking and sharing the most.
- Department with Highest Usage: This shows you which department is using the feedback system the most. It's a good sign that this department talks openly and is focused on helping its people grow.
- Department with Least Usage: This shows you which department is using the feedback system the least. Knowing this can help you figure out ways to get this department more involved in giving and getting feedback, so everyone has a chance to improve.
Filters & Quick Actions
Filters: You can filter all charts and stats by Department and Date Range to focus on specific teams or periods.
-
Quick Actions: From the summary page you can also:
Give Praise
Give Feedback
Request Feedback
Write Internal Notes
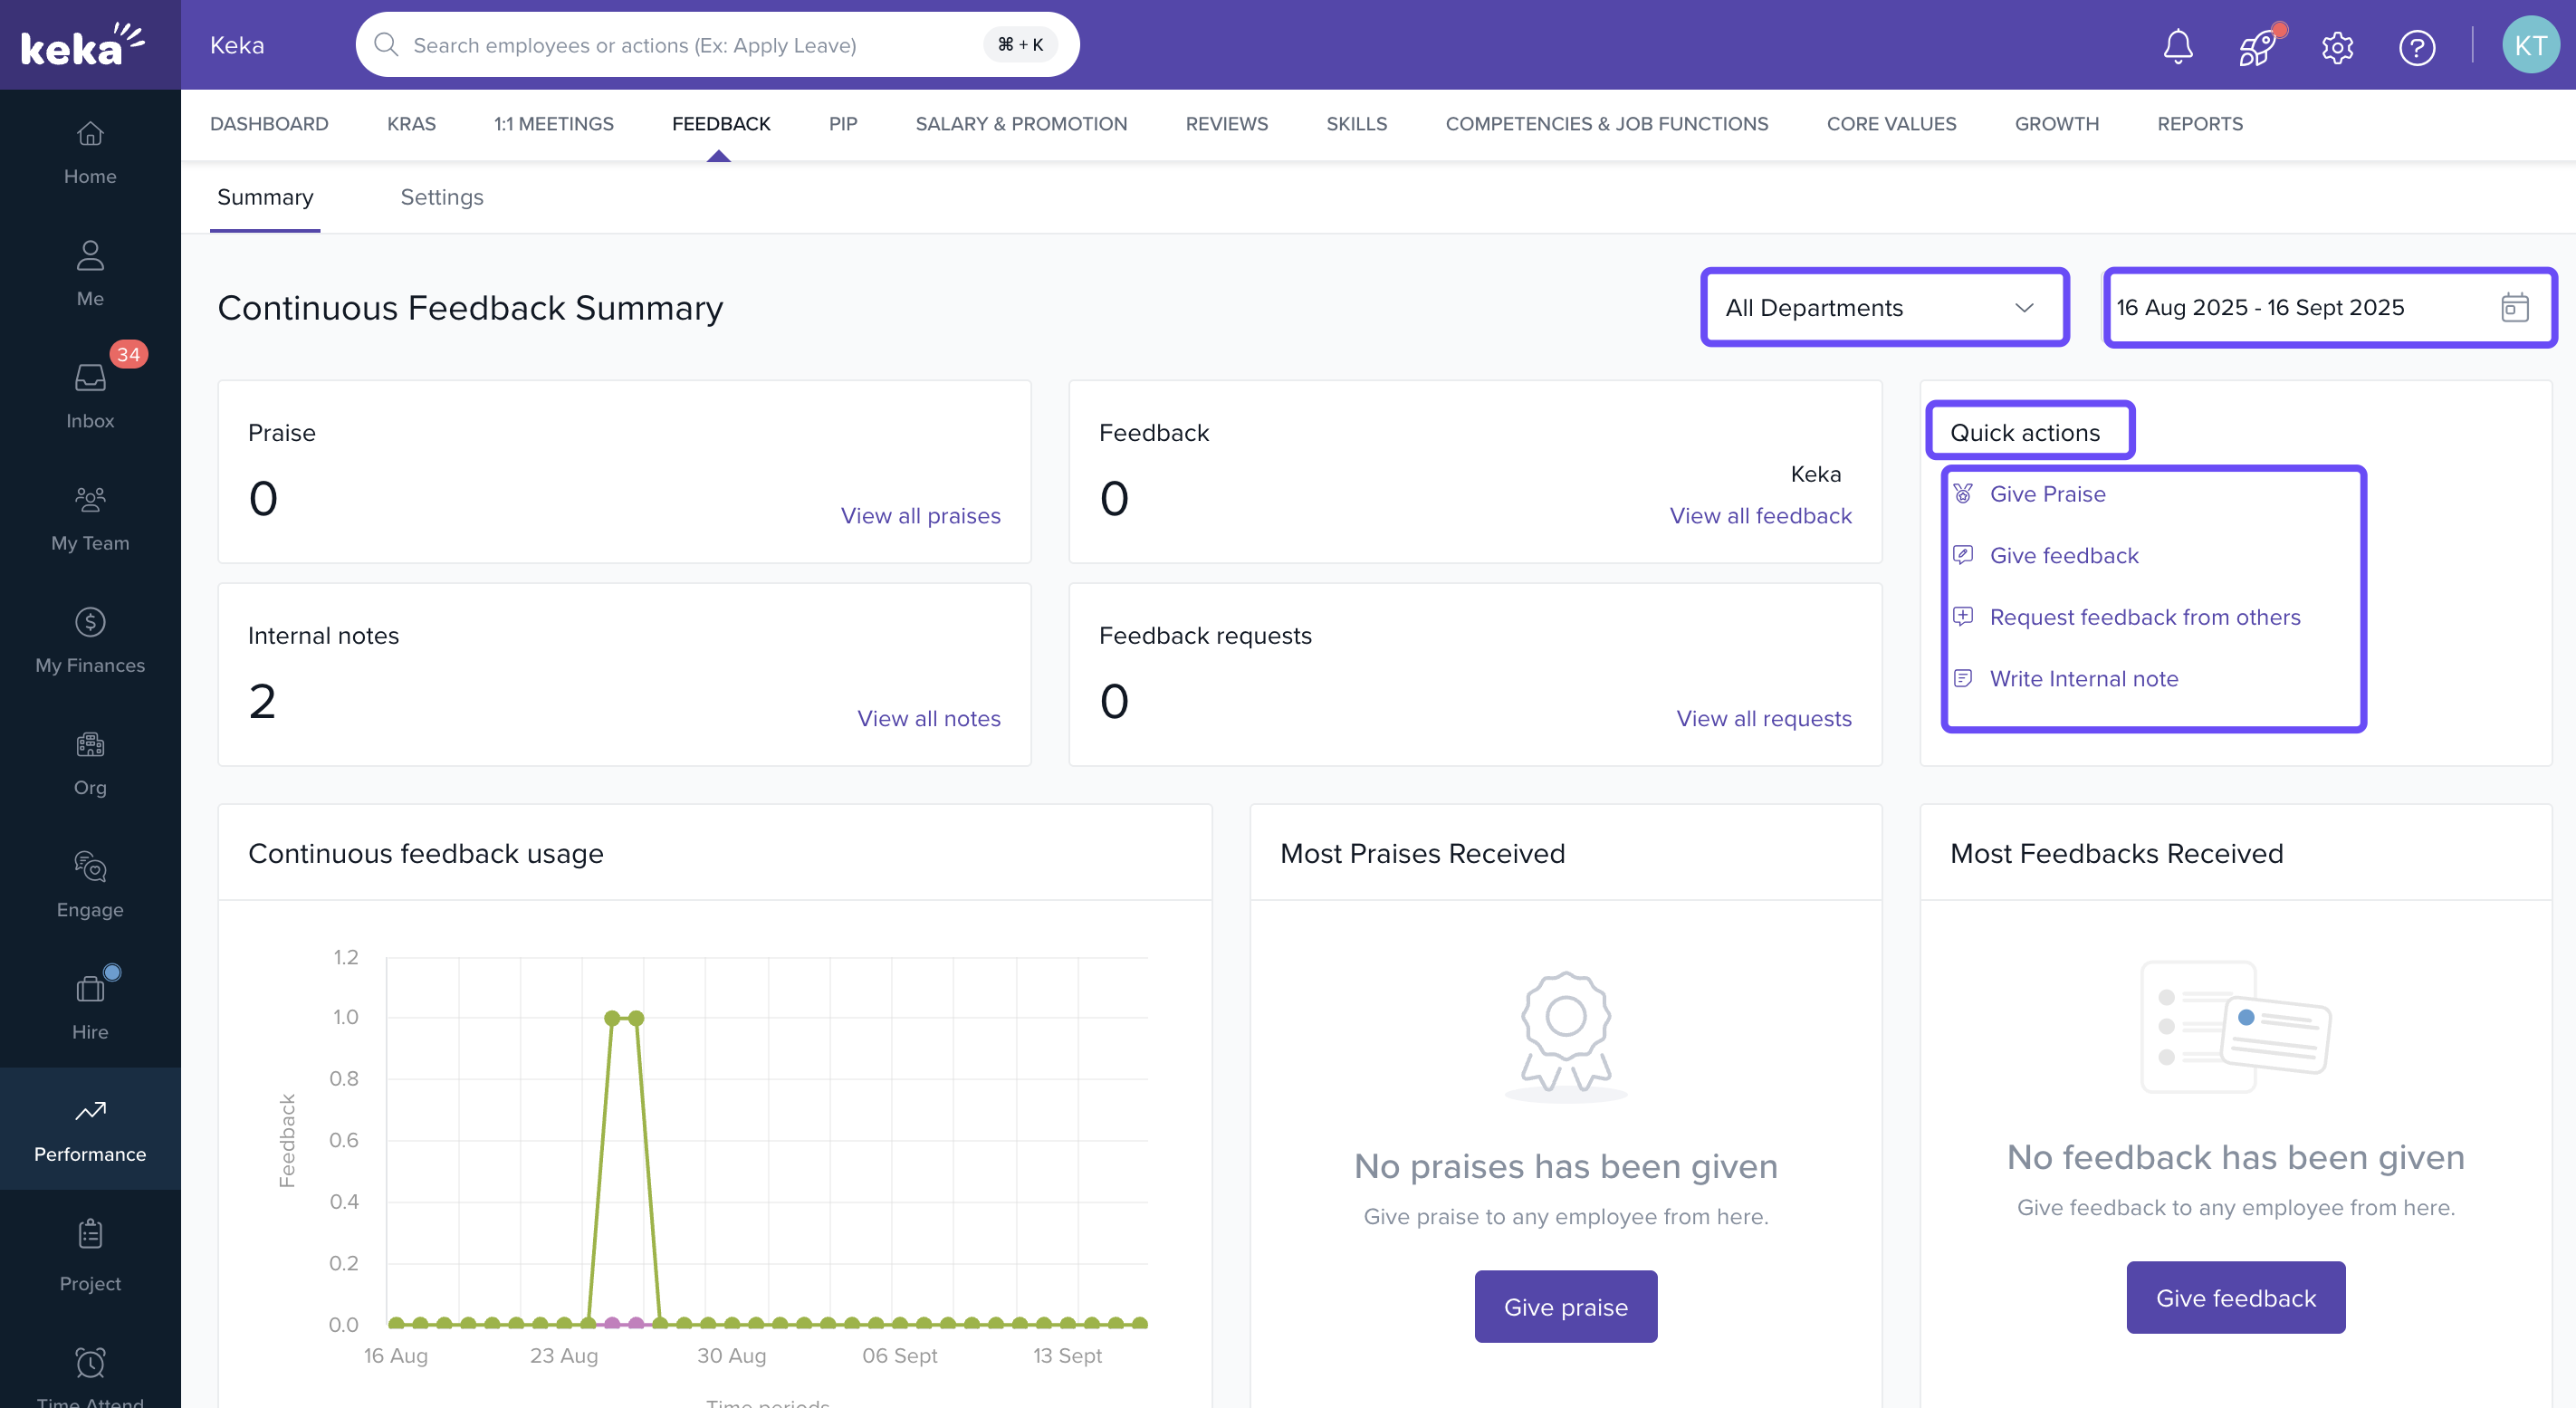
These allow you to respond or act directly from the summary dashboard.
Notes & Tips
- Tip: Regularly monitor departments with low feedback usage — they might benefit from training or awareness sessions.
- Important: The Quality of feedback matters as much as the quantity. Encourage specificity (what exactly was good/improvable), so feedback is actionable.
Next Steps
If the badges haven’t been set up yet: go to Settings → Badges & Certificates to configure them.
Encourage managers to use Request Feedback more often if requests are low.
Schedule periodic check‑ins using these insights to maintain high feedback engagement.
Comments
0 comments
Please sign in to leave a comment.