Introduction
Use Keka’s Employee Analytics to get a clear view of your workforce demographics—such as age, gender, tenure, and employment type. These insights help you understand employee trends, support diversity, and refine internal policies.
You can filter this data by Department, Location, Business Unit, and other parameters to focus on specific parts of your organization.
Where to find it:
Org > Dashboard > Analytics > Headcount by Demographics
Why is demographic information important?
Demographic data helps you:
Understand your workforce better: Tailor company policies and engagement initiatives to your people.
Improve diversity and inclusion: A diverse team brings multiple perspectives and stronger decision-making.
Evaluate tenure and experience balance: Understand retention trends and balance between experienced staff and new talent.
These insights go beyond basic statistics—they’re essential for building a motivated and inclusive workforce.
How to view Demographic Analytics
Go to the Org tab on the left navigation menu.
Click on Dashboard.
Select the Analytics tab.
Open the Headcount by Demographics section.
You’ll see several visual charts that display different demographic data points across your workforce.
Use the drop-down filters at the top of the page to focus your analysis. You can filter by:
Departments
Business Units
Locations
Date ranges
For example, to view gender distribution specifically for the Sales department, just select “Sales” from the Department drop-down.
Tip: Filtering allows you to drill down into specific segments of your organization for more targeted insights.
.png)
Demographics by Age
In this section, you’ll see graphs that show how your workforce is distributed by age and tenure.
Age of Employees (in Years)
Displays the age distribution of employees across different age bands.
Hover over each bar to see detailed counts, including gender-wise breakdown.
Shows the overall average age, as well as averages for men and women.
Years in Organisation
Displays how long employees have been part of the organization.
-
Includes:
Minimum and maximum tenure
Average tenure across the company
Tip: Hover your mouse over any bar to view detailed data, including a gender-wise split.
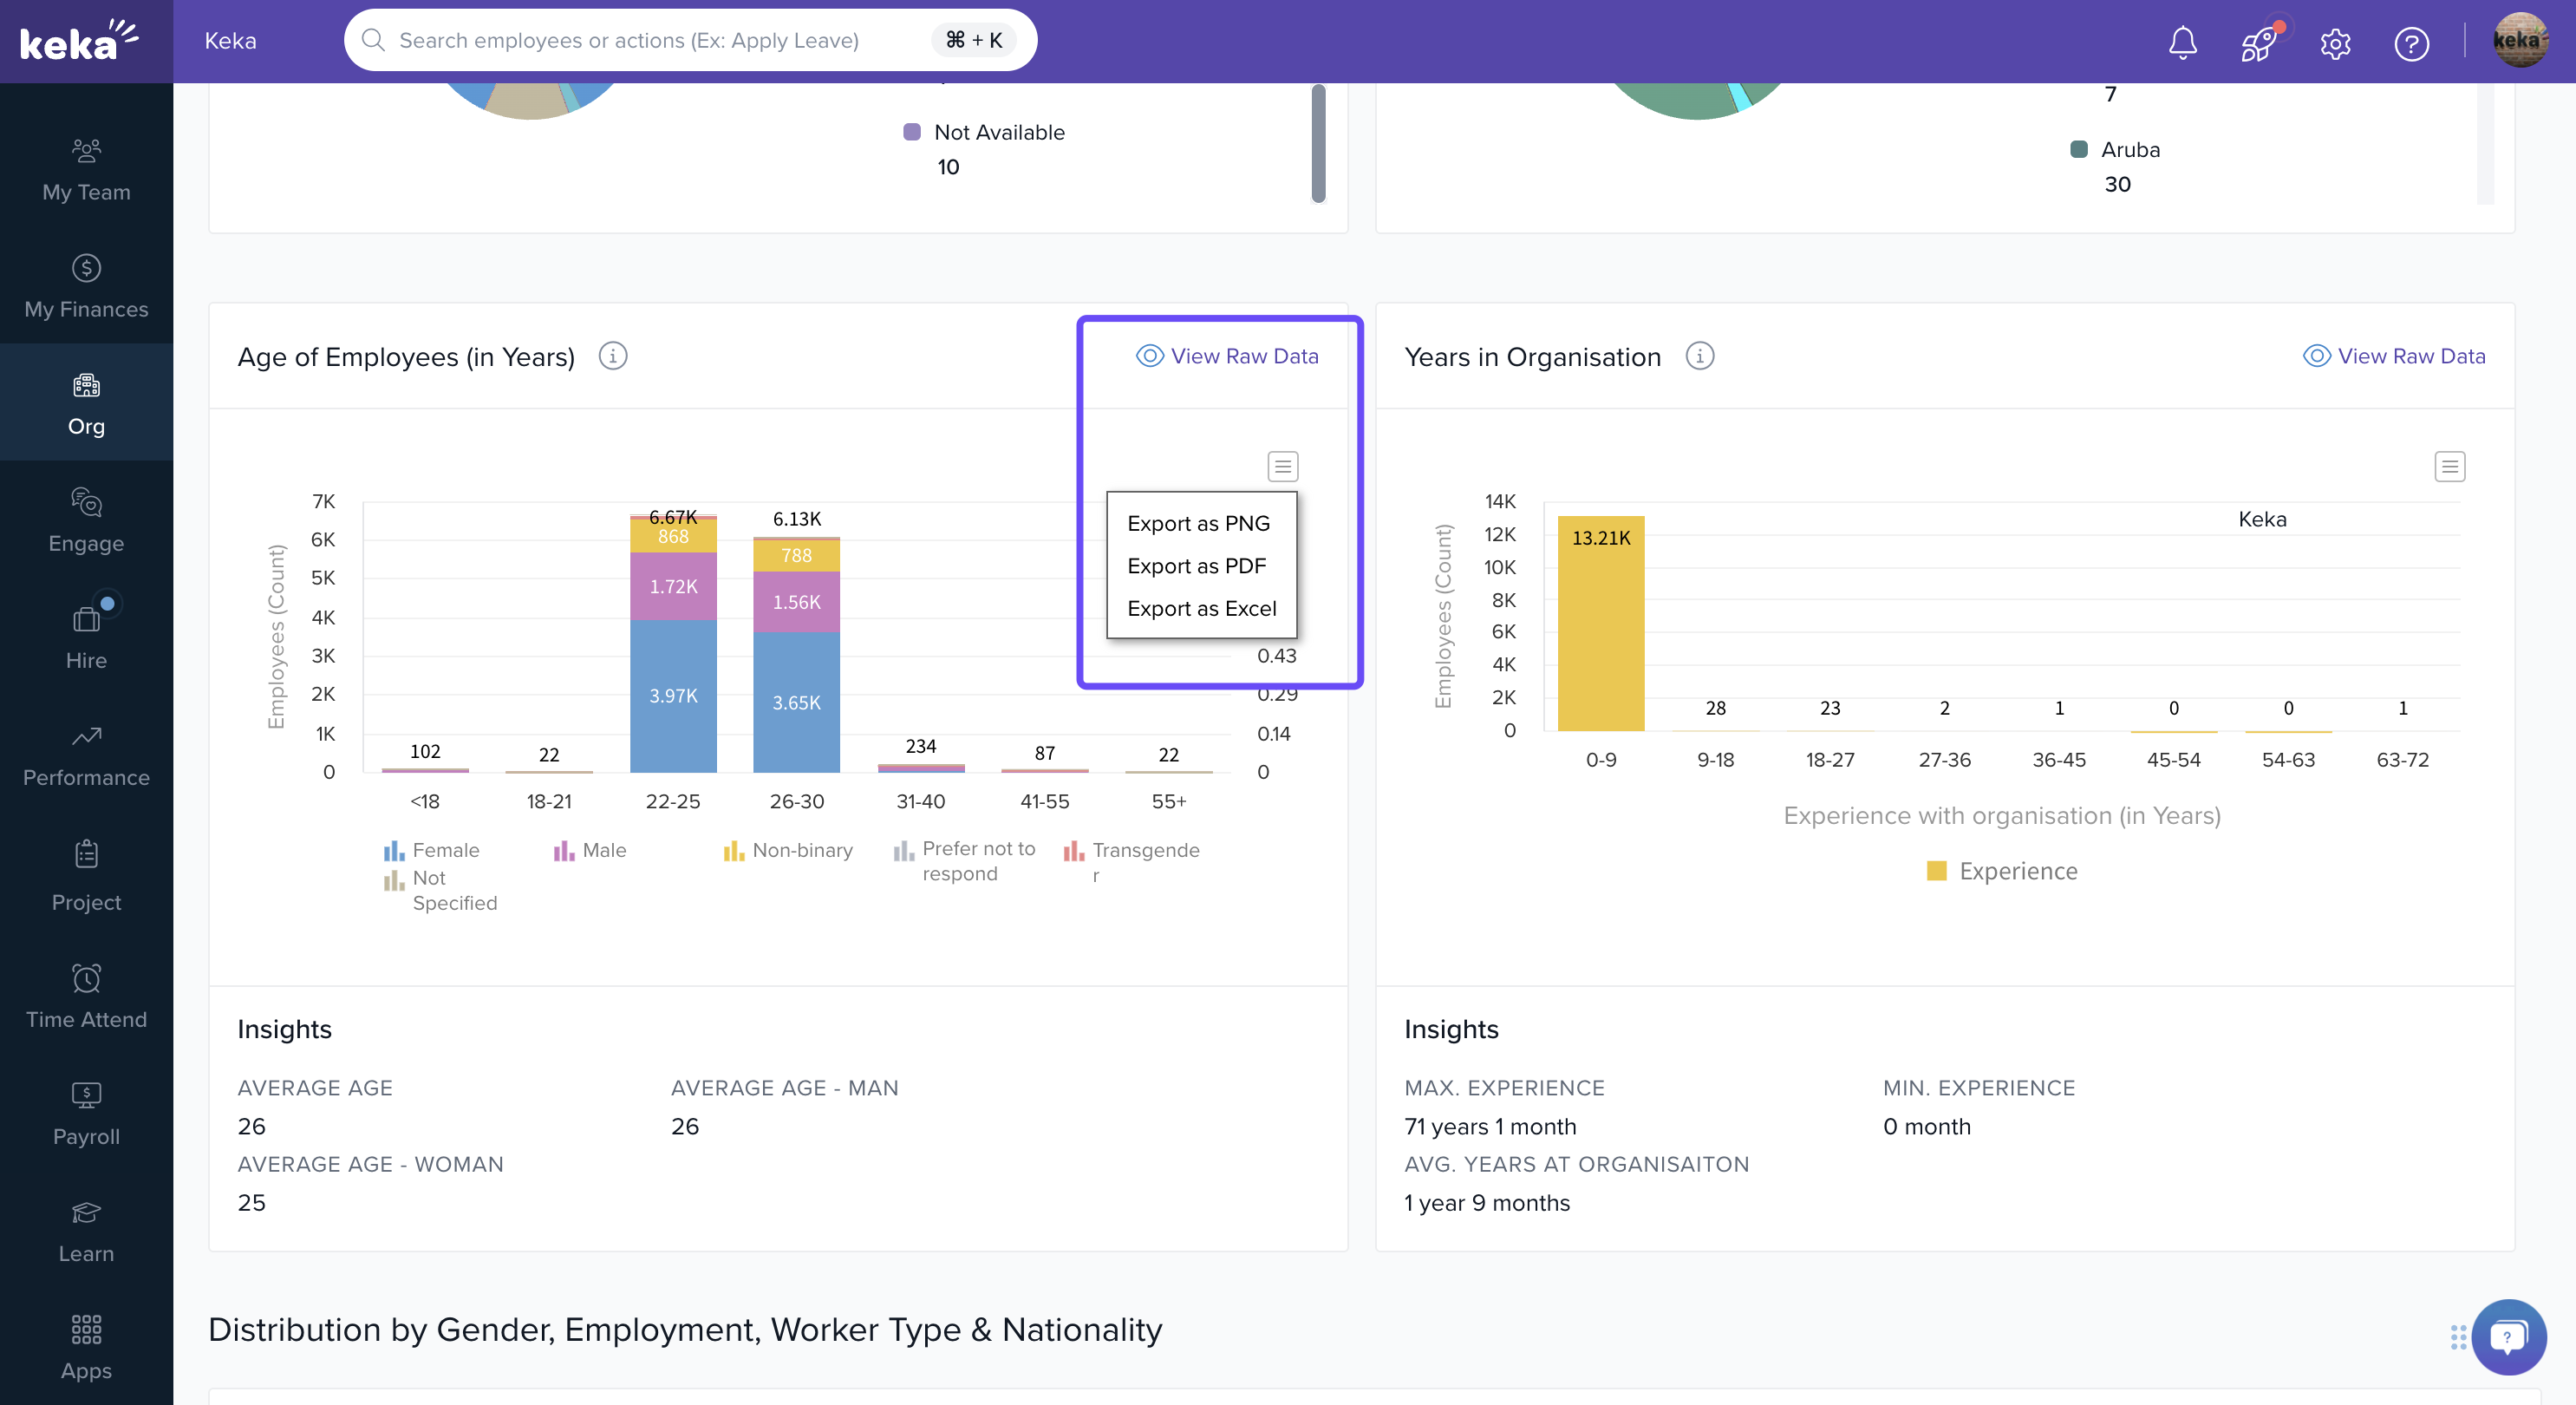
You can also view and download the raw data for both graphs, which provides detailed figures that can be used for further analysis.
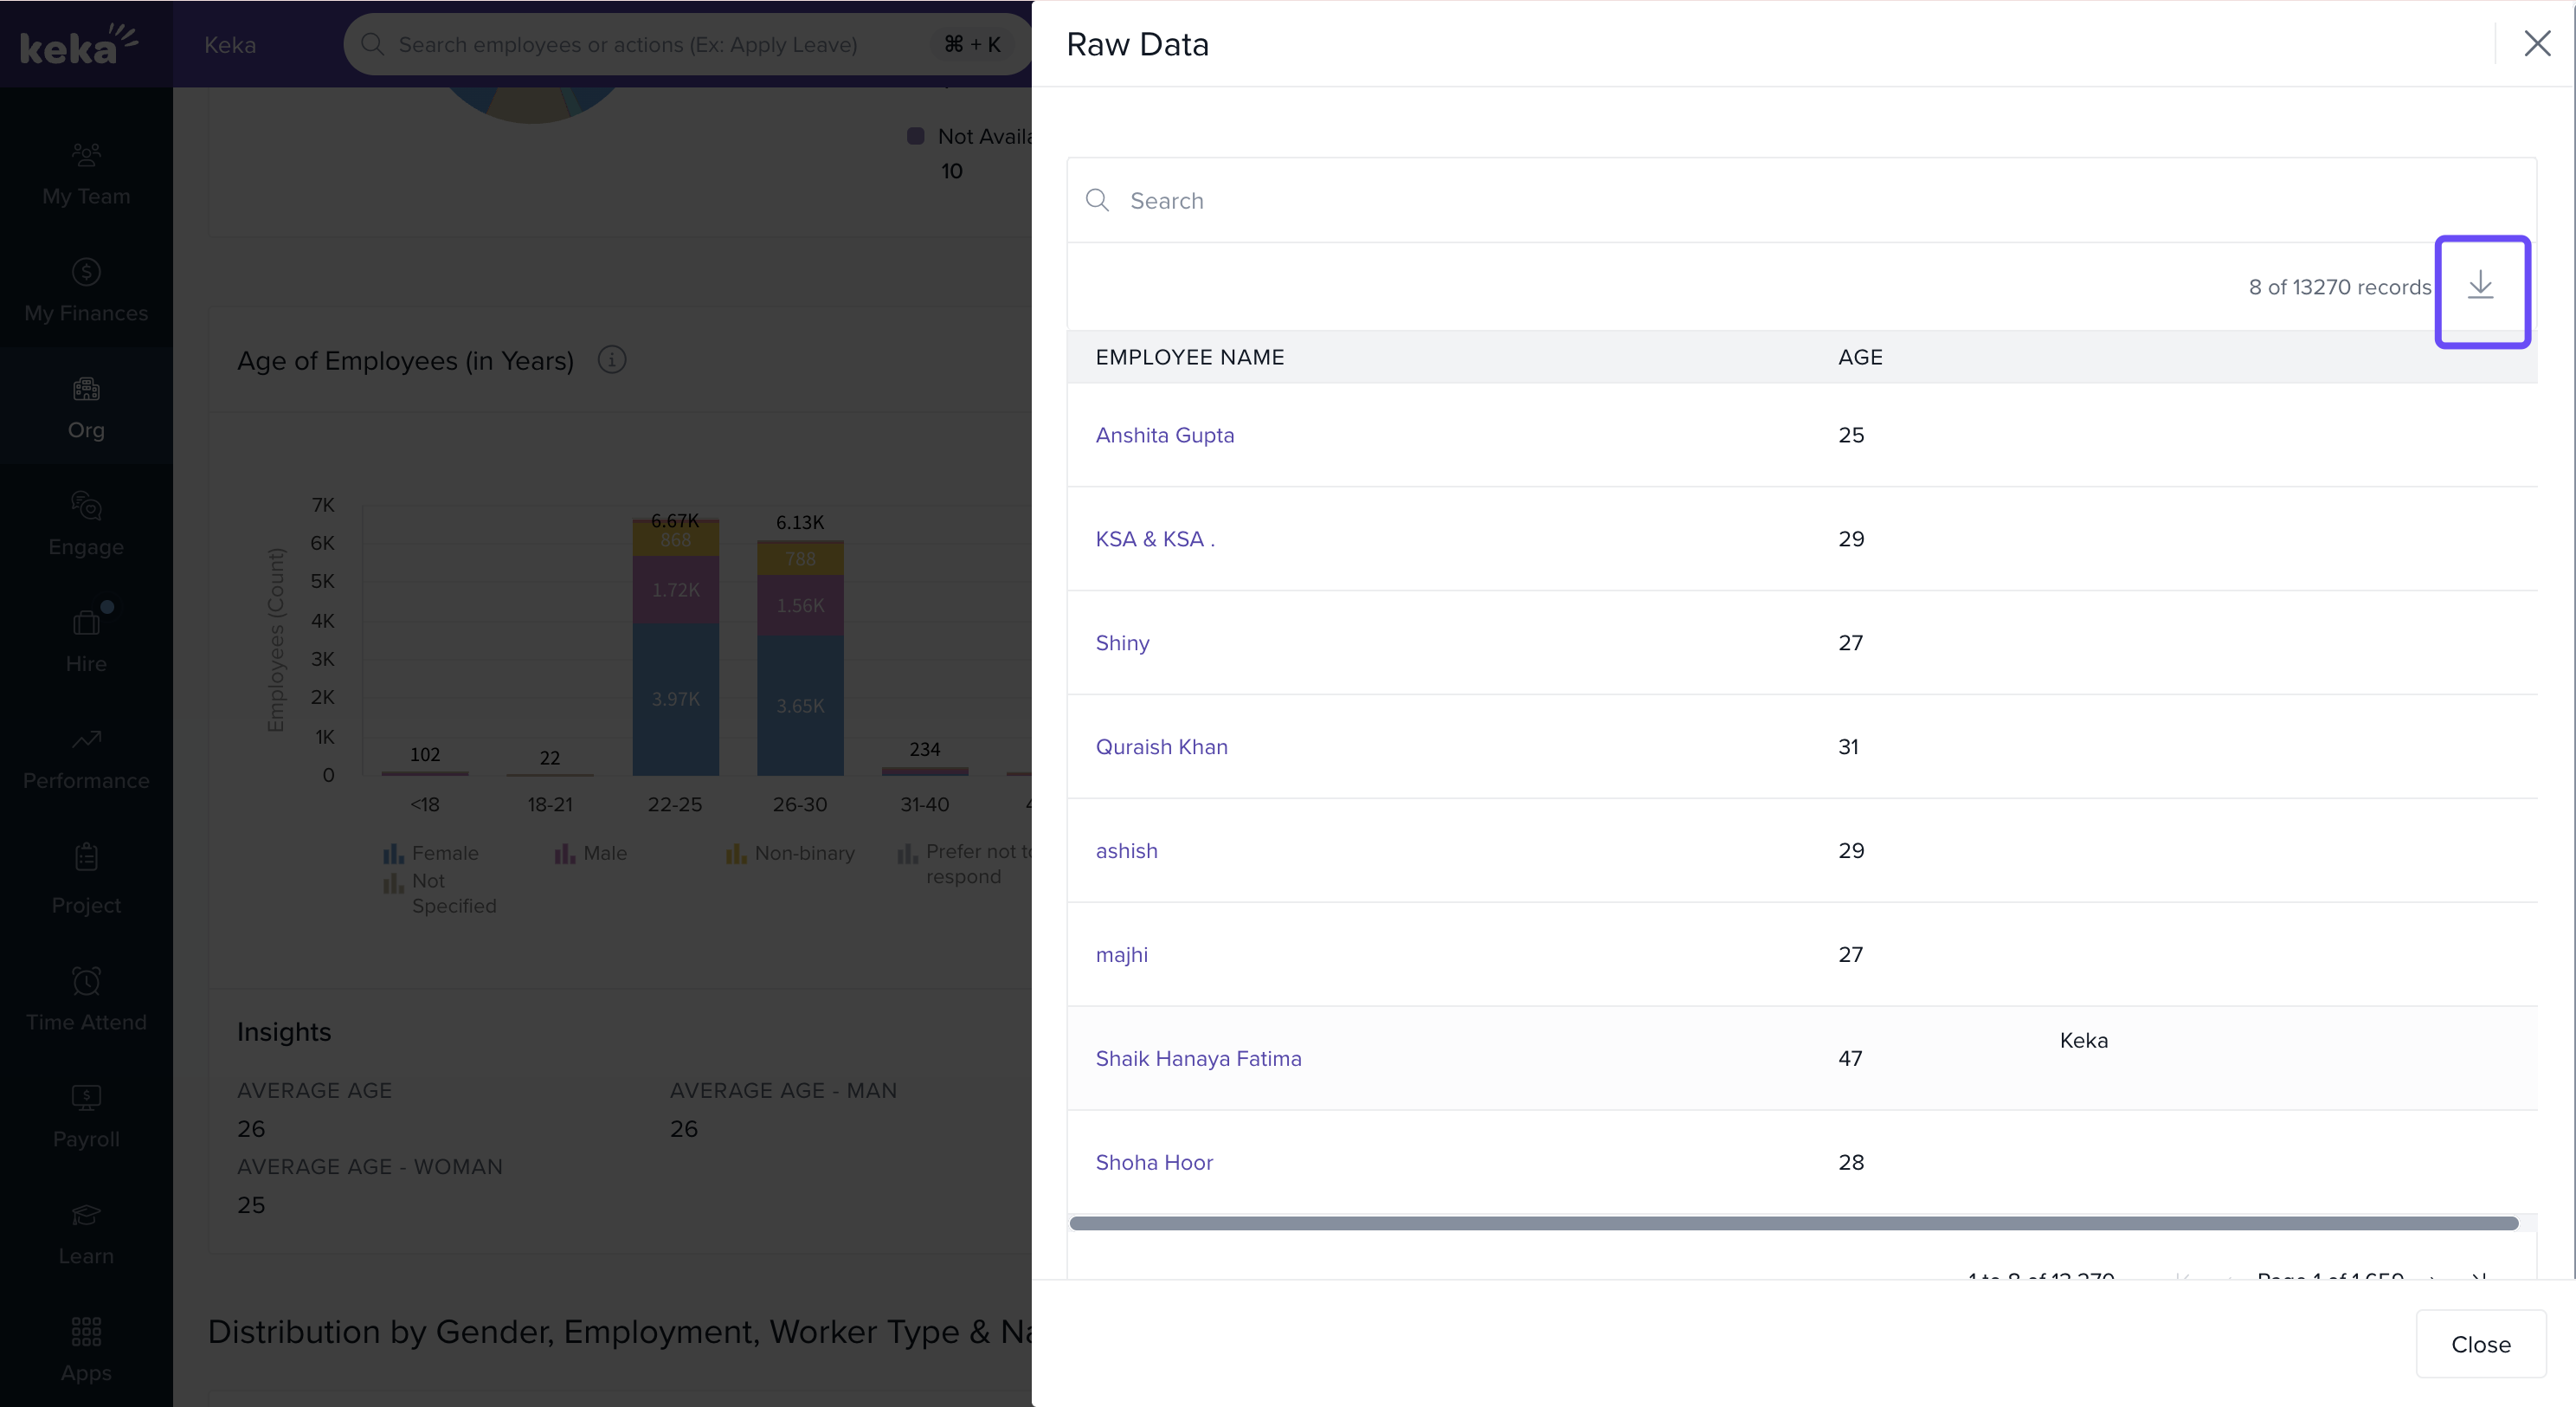
Export: Click the export icon on each chart to download it in PNG, PDF, or Excel format.
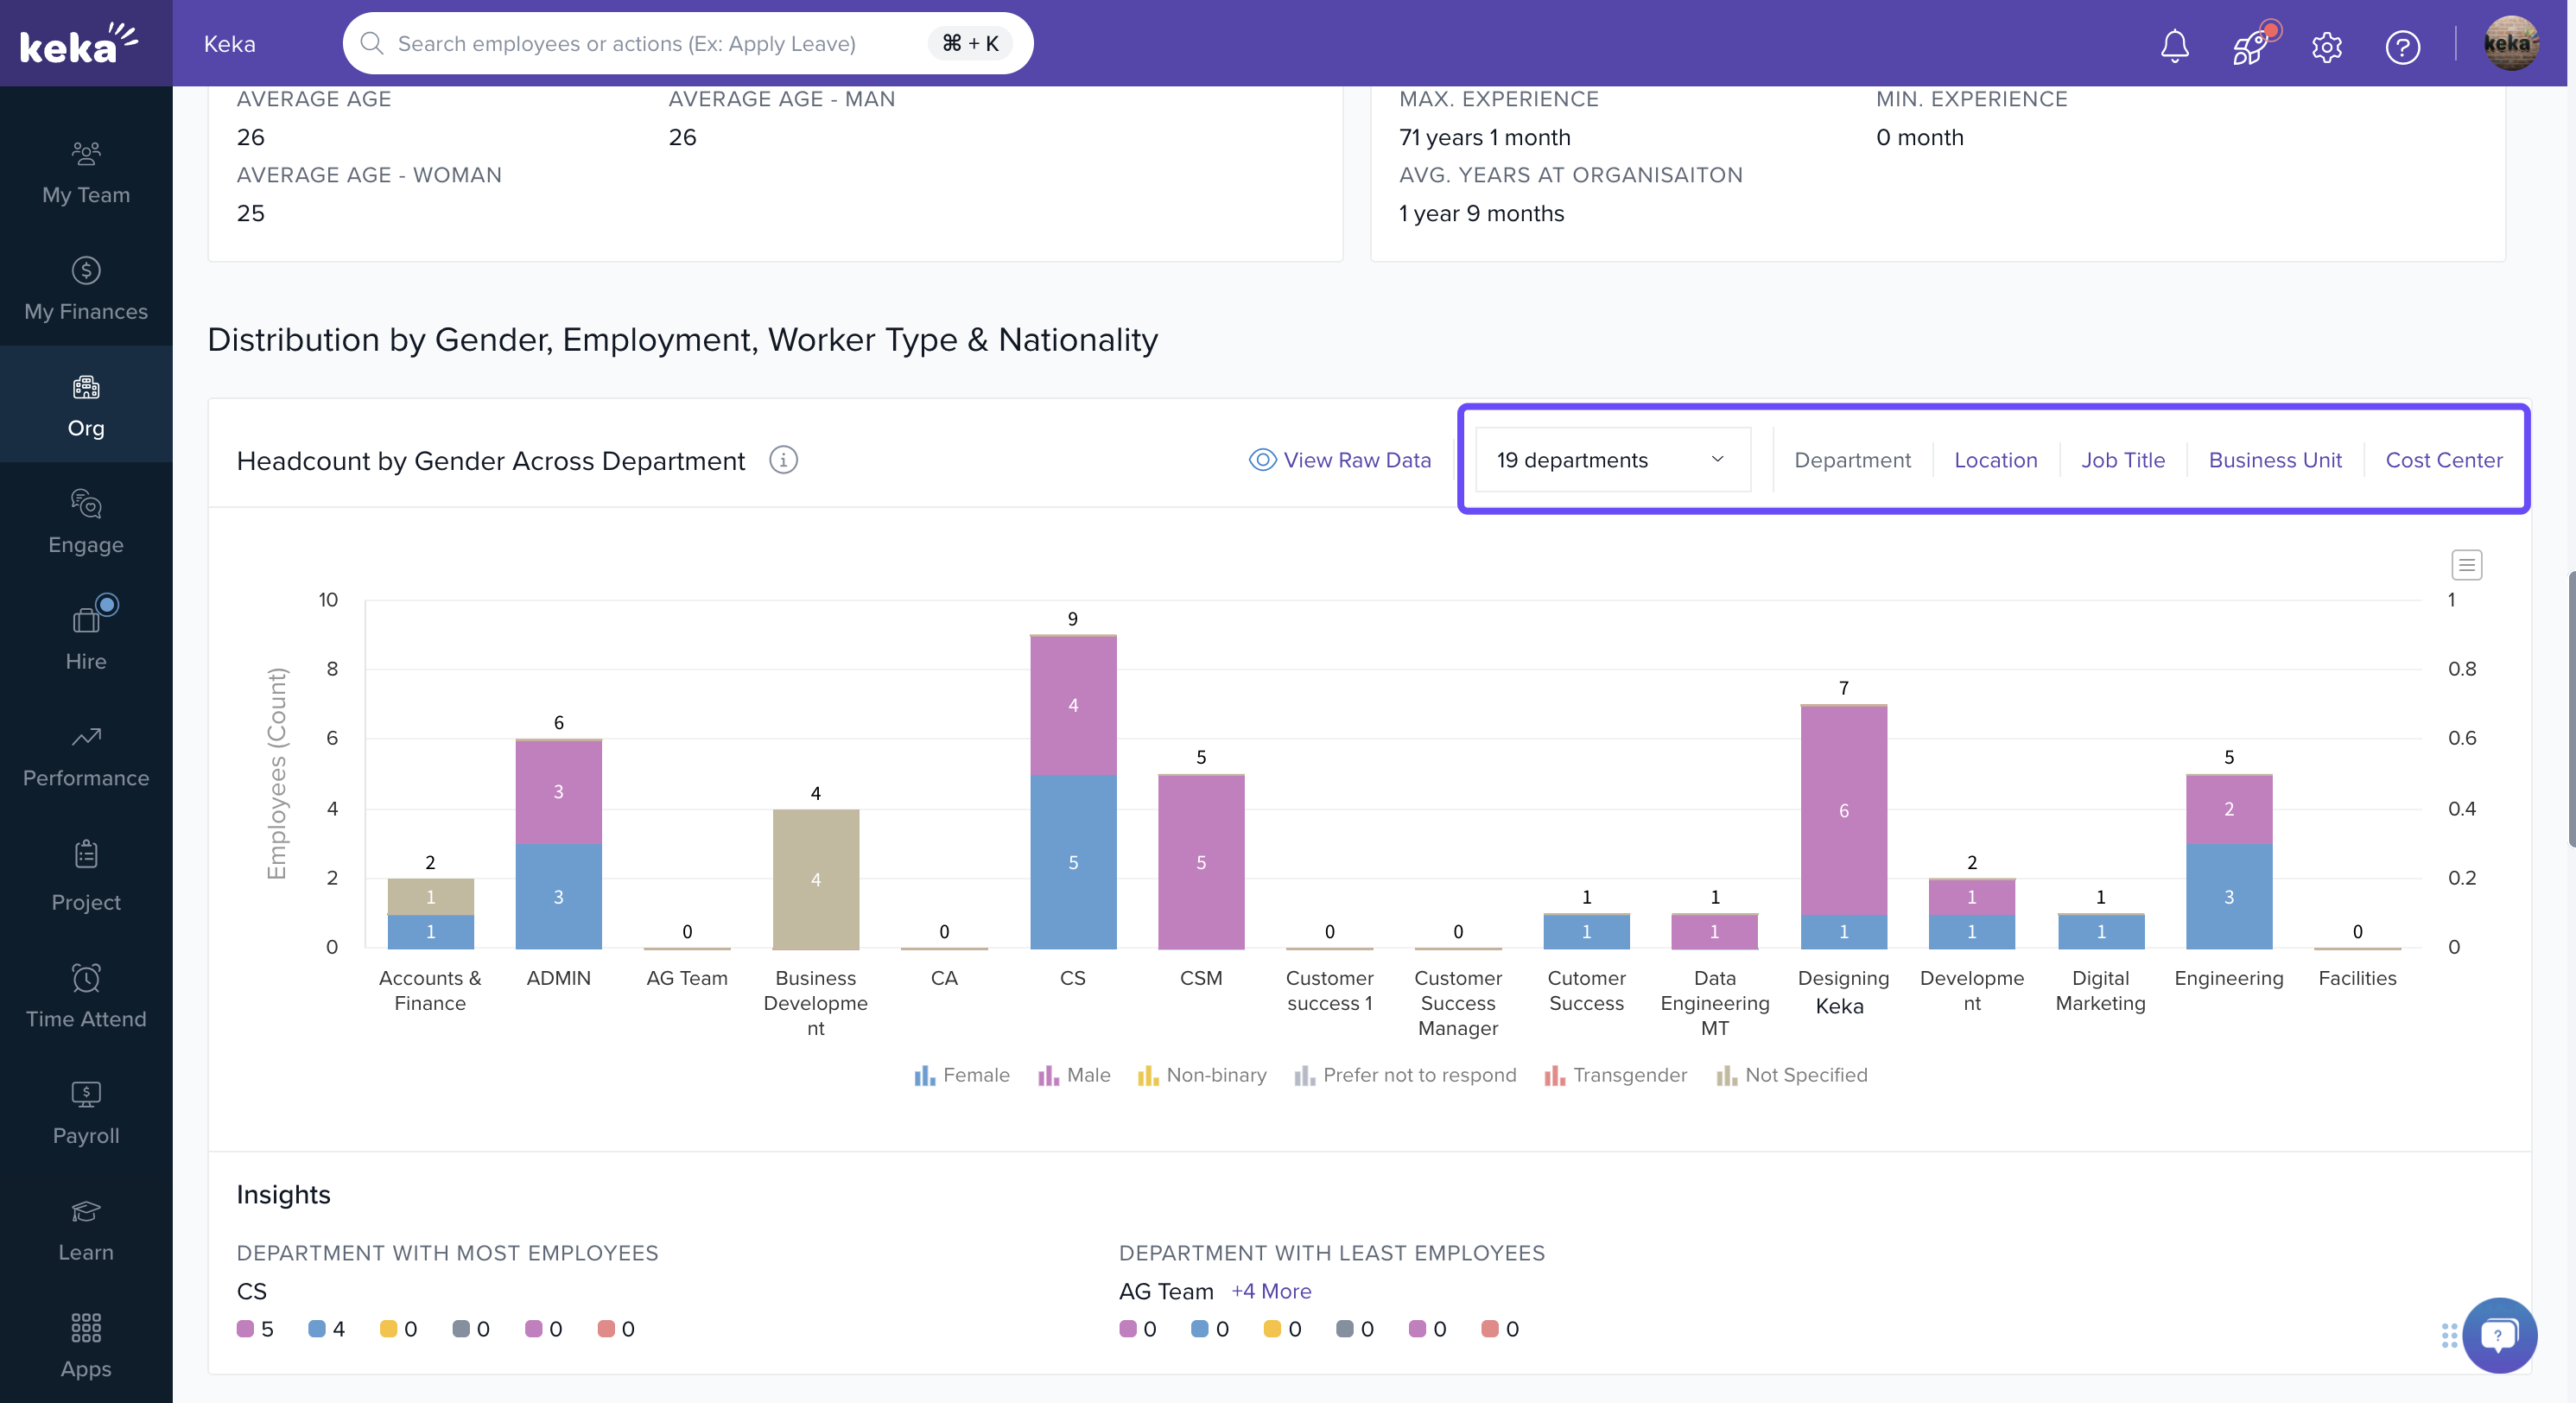
Demographics by Gender
Navigate to the Distribution by Gender, Employment Type and Worker Type section for deeper insights.
This includes 3 graphs:
1. Gender Distribution
Shows gender split across various parameters. You can toggle between:
Departments
Business Units
Locations
Cost Centers
Job Titles
Example: View how gender representation varies by job title or cost center.
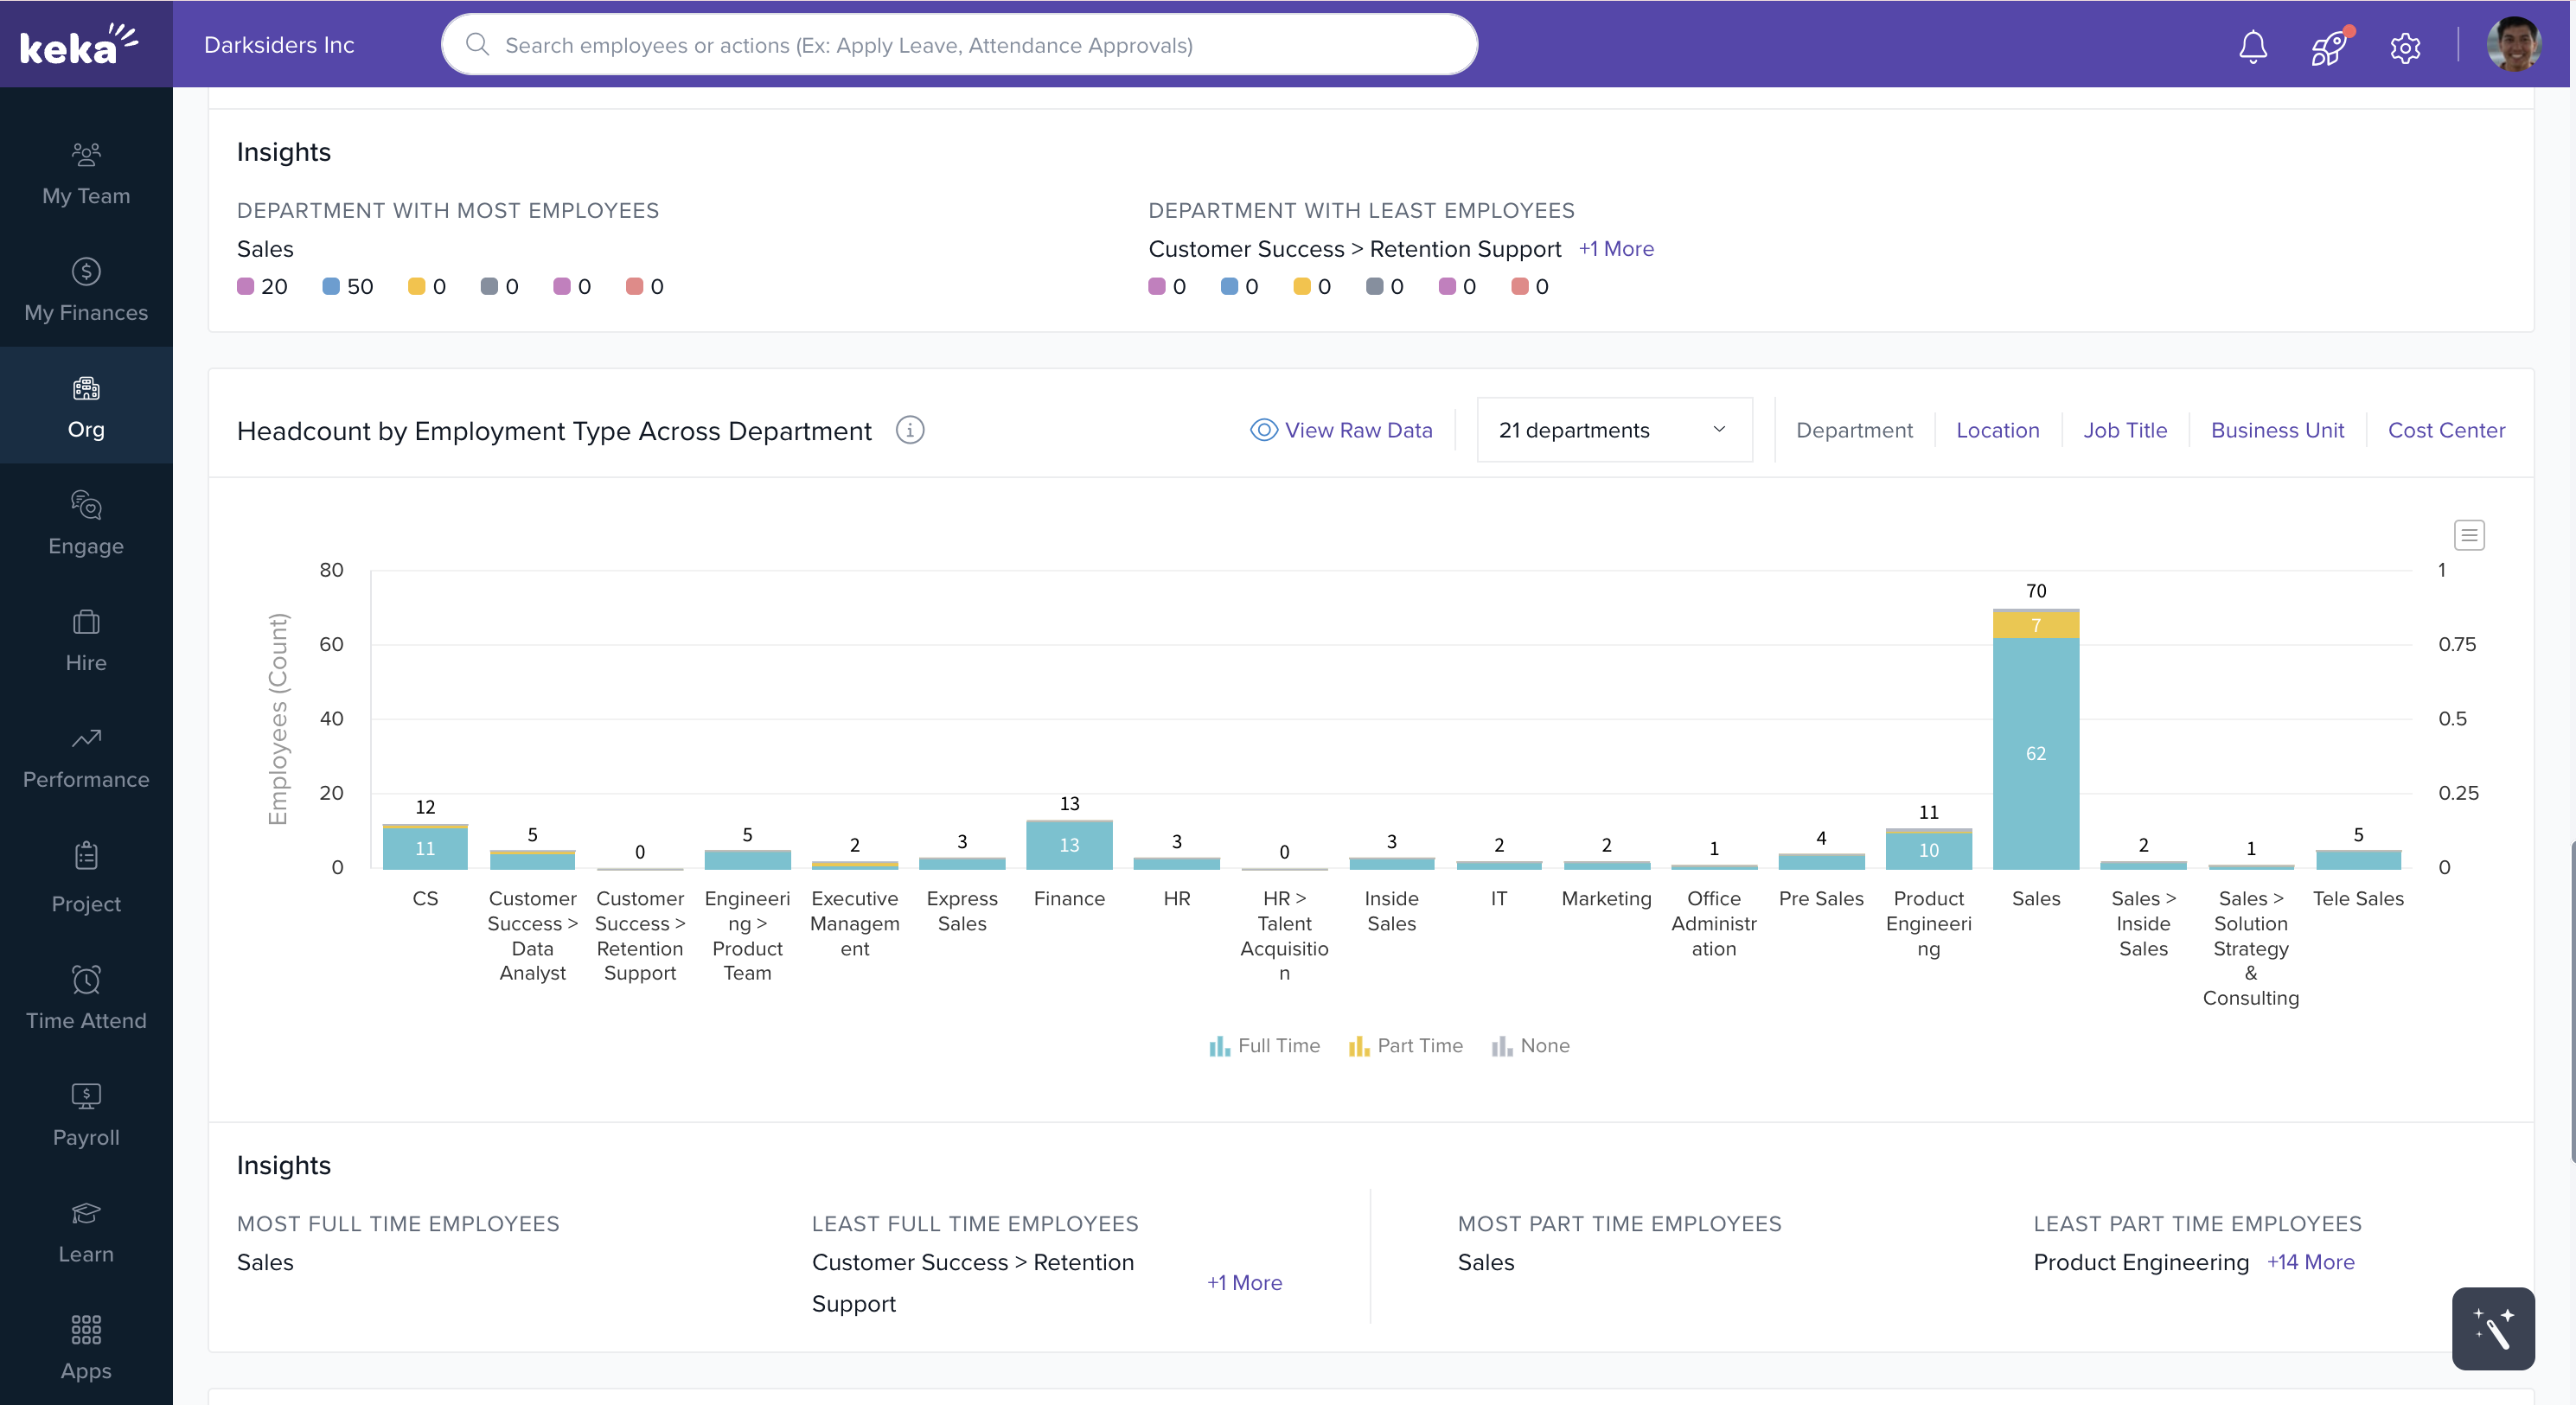
Headcount by Employment Type Across Departments
This graph displays how your workforce is divided between full-time and part-time employees across:
Departments
Locations
Business Units
Job Titles
Cost Centers
You can filter down to view a specific department or unit.
Note: Raw data is available for download for deeper analysis.
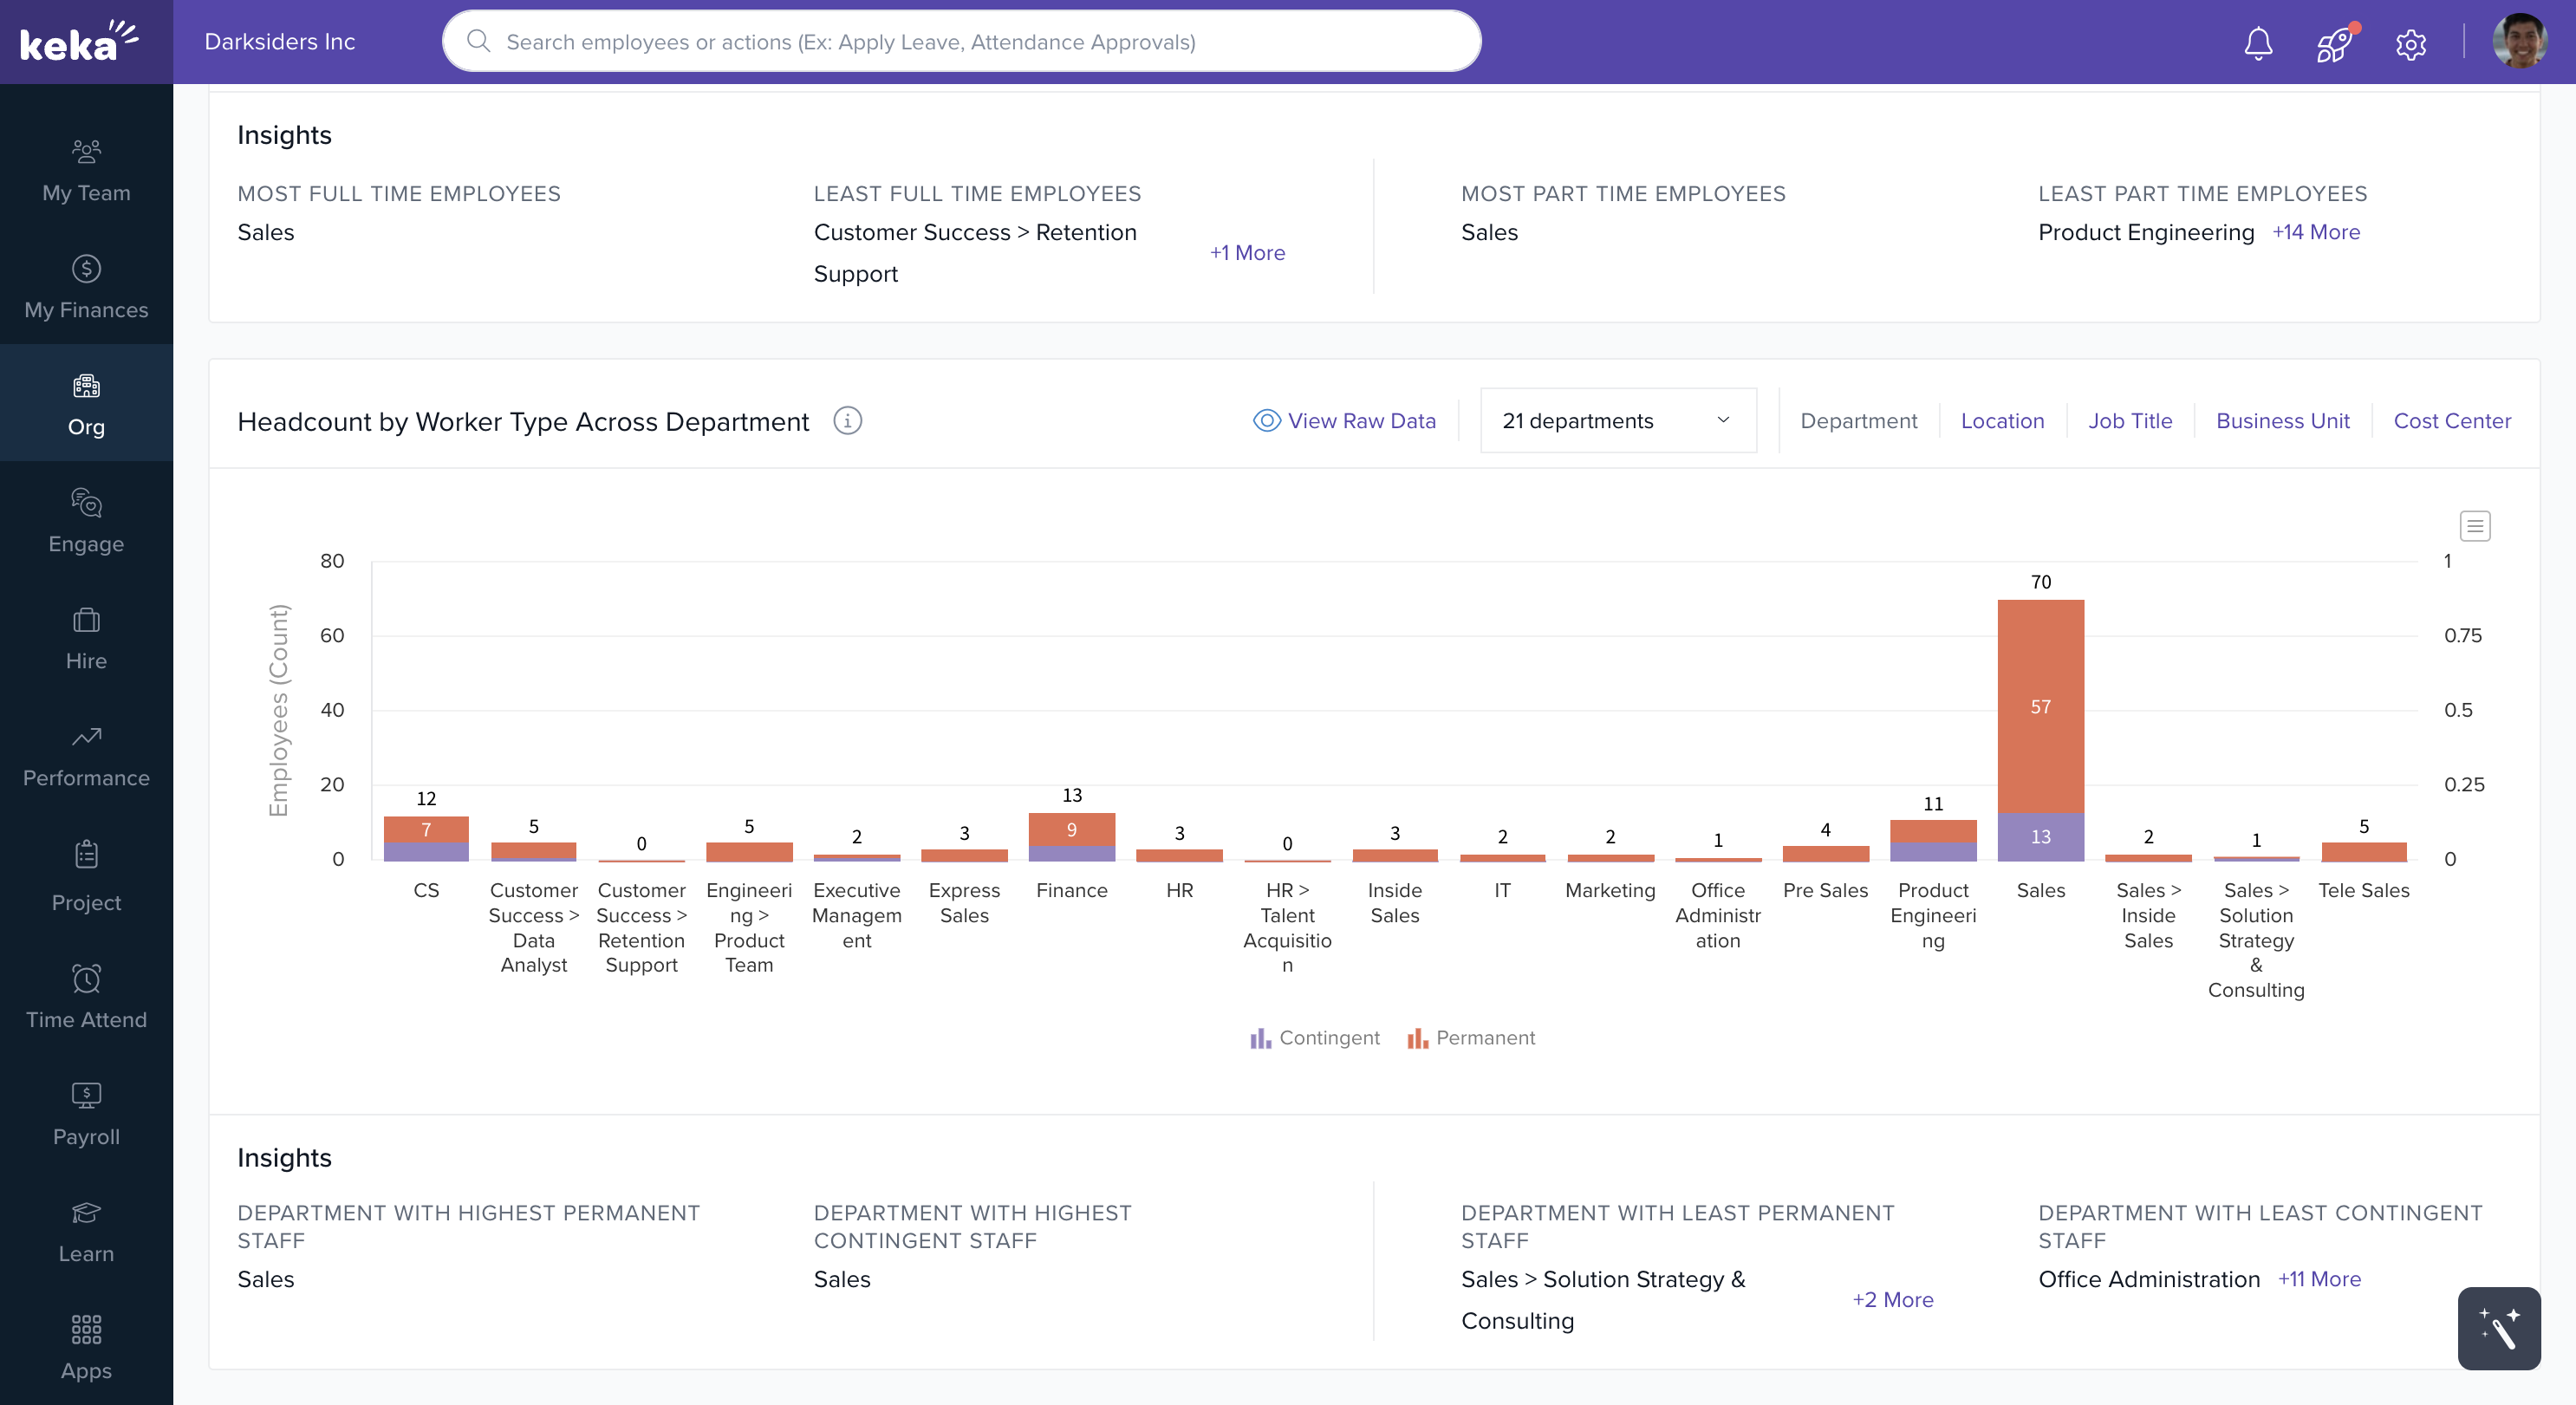
Worker Type
This section shows the split between permanent and contingent workers (e.g., contractors, interns).
You can view this data by:
Department
Business Unit
Location
Job Title
Cost Center
Download Option: All charts in this section also support export in PNG, PDF, or Excel formats.
Comments
0 comments
Please sign in to leave a comment.