
As an admin, you hold the responsibility of overseeing the attendance and work hours of your employees. Keka's robust Dashboard, located in the Time and Attendance section, provides you with all the tools you need for this. Let's explore what each sub-section has to offer.
TABLE OF CONTENTS
- Attendance Summary
- Attendance Analytics
- Most Hours Worked
- Overtime Hours
- Work hours shortage
- Most Breaks Taken
- Leave Summary
- Leave Analytics
Start by navigating to Time attend section on the left pane, this will directly land you on the Attendance summary page in the Dashboard section.
Attendance Summary
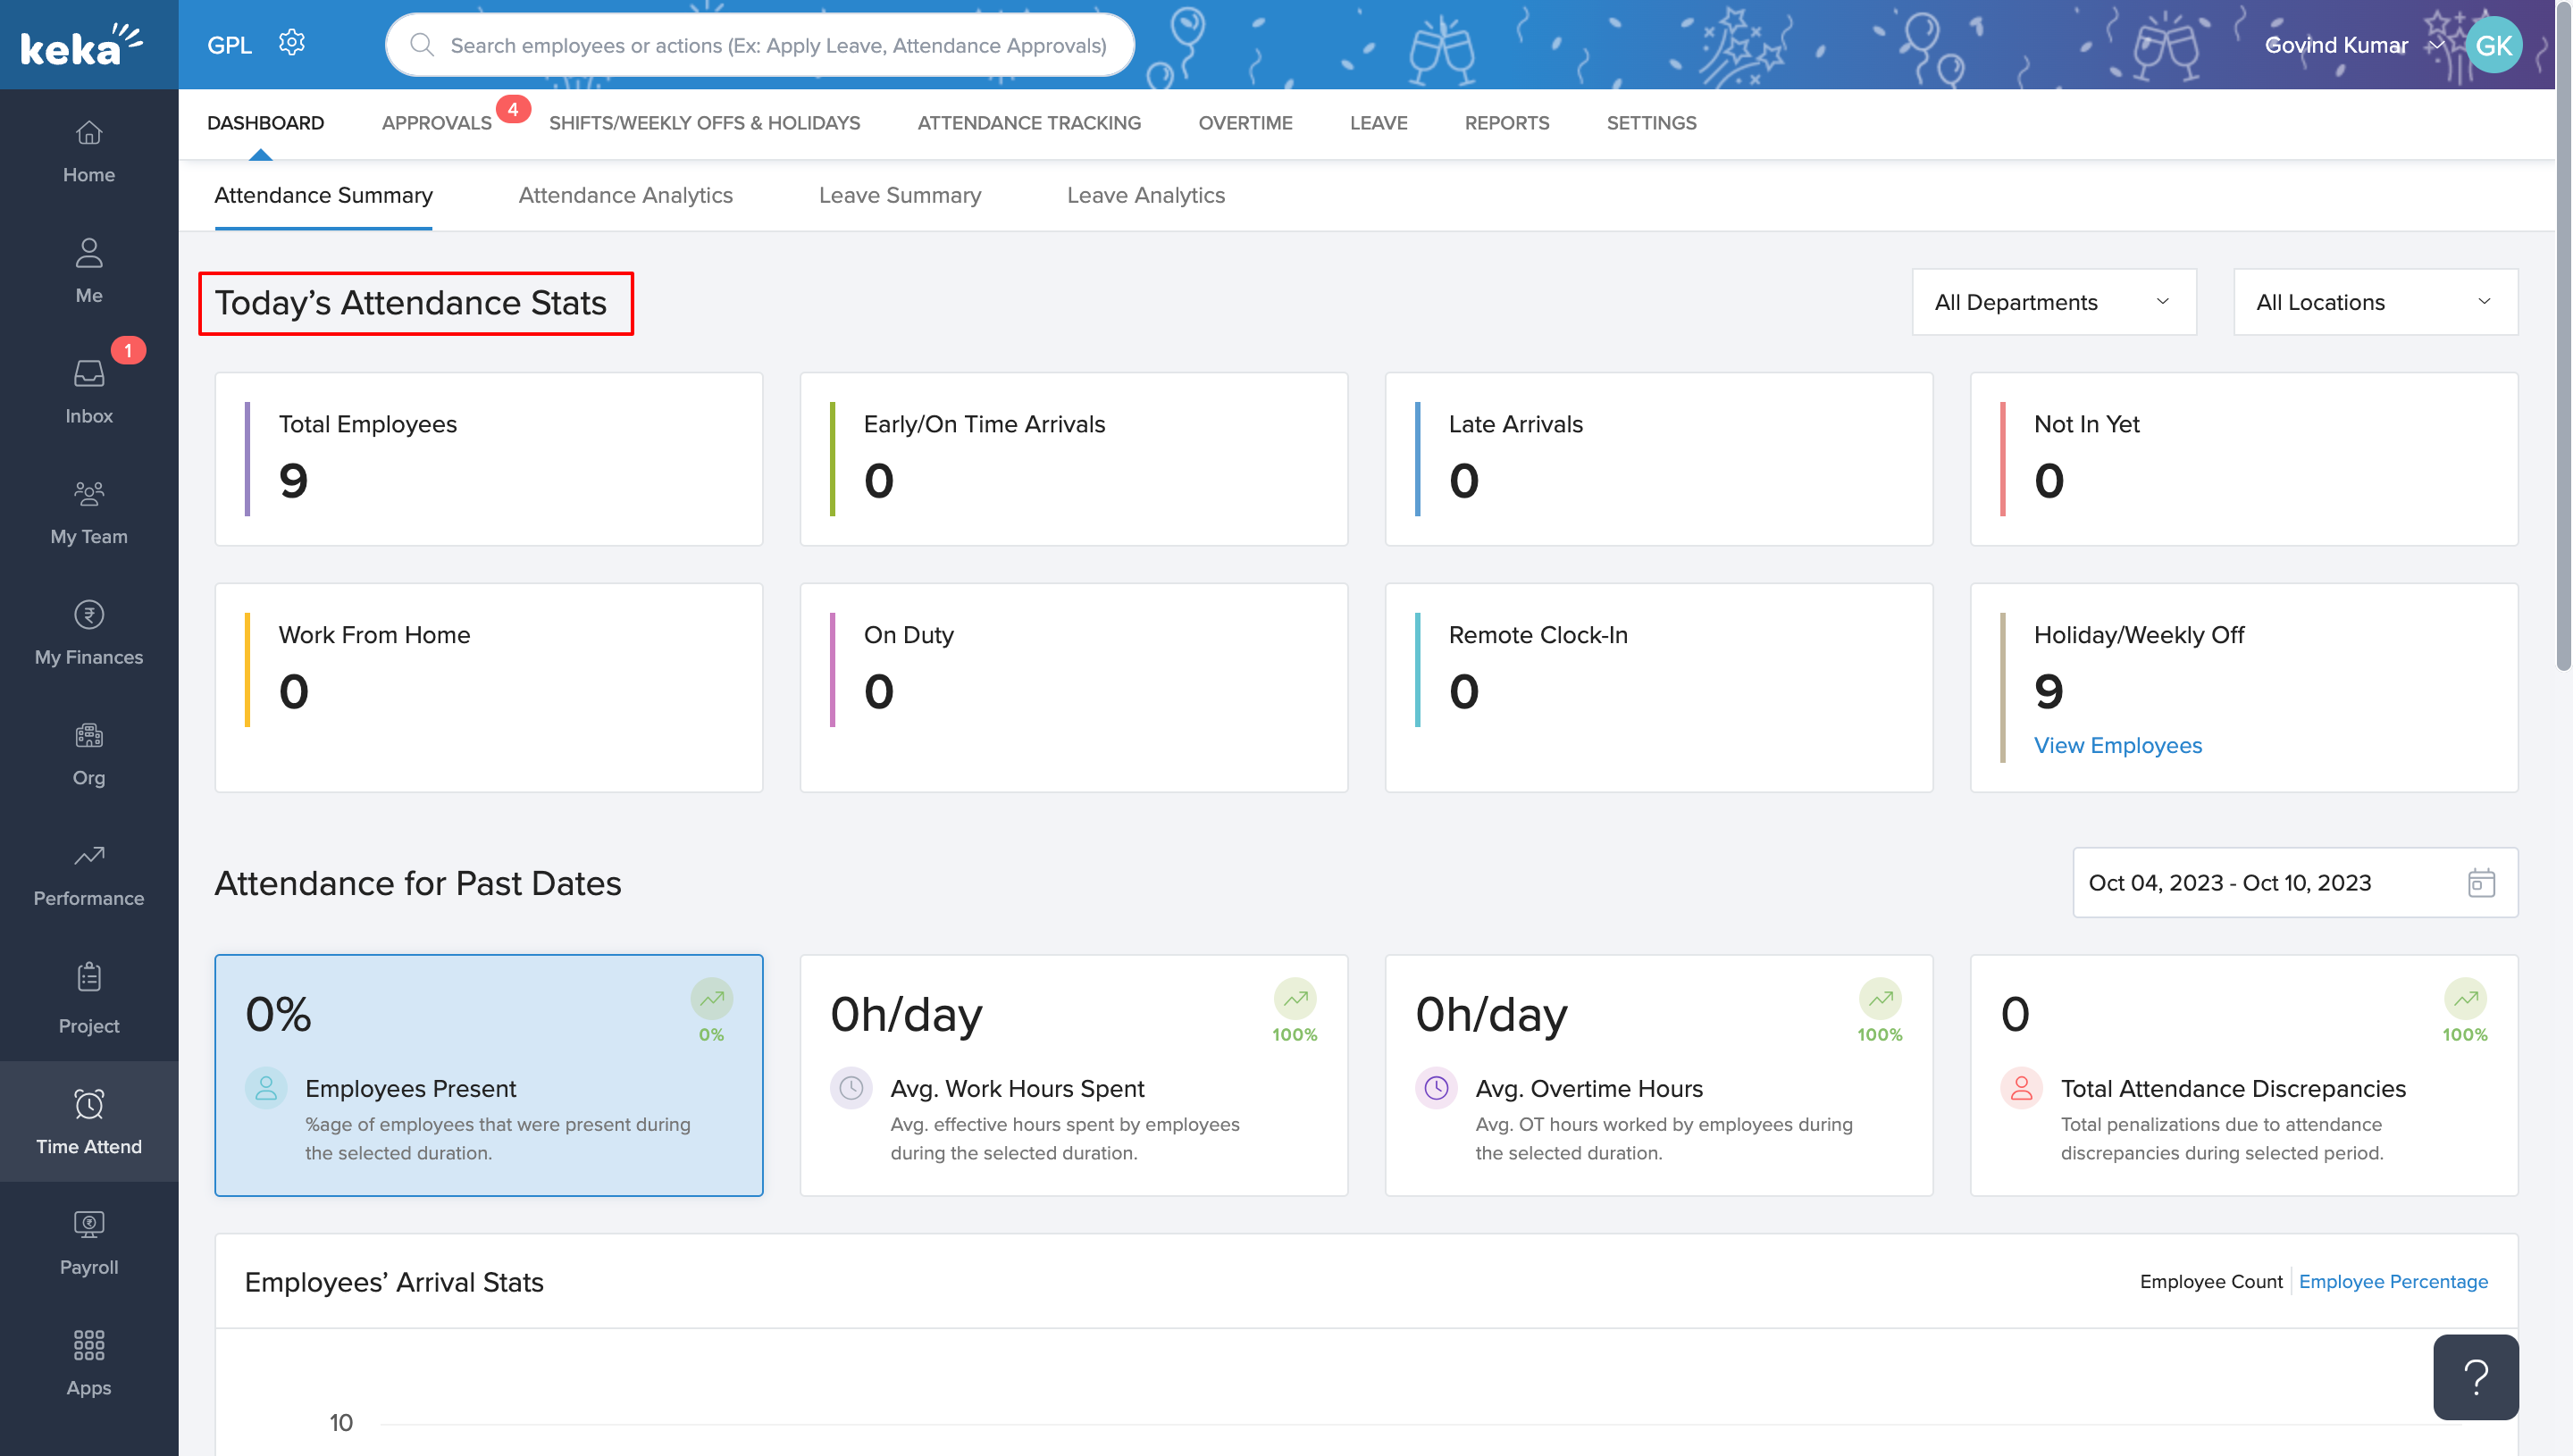
Today's Attendance Stats
Get a complete picture of the current day’s attendance here. It covers multiple departments and locations, displaying:
Total Employees: Know the total headcount for the day.
Early or Late Arrivals: See who's punctual and who's not.
Yet to Arrive or Working Remotely: Track absenteeism and remote working.
On Holidays or Weekly Offs: Find out who's on a break today.
For an employee-specific breakdown, click the "view employees" option under stats.
Attendance for Past Dates
This area offers a variety of graphs and stats for any chosen time range.
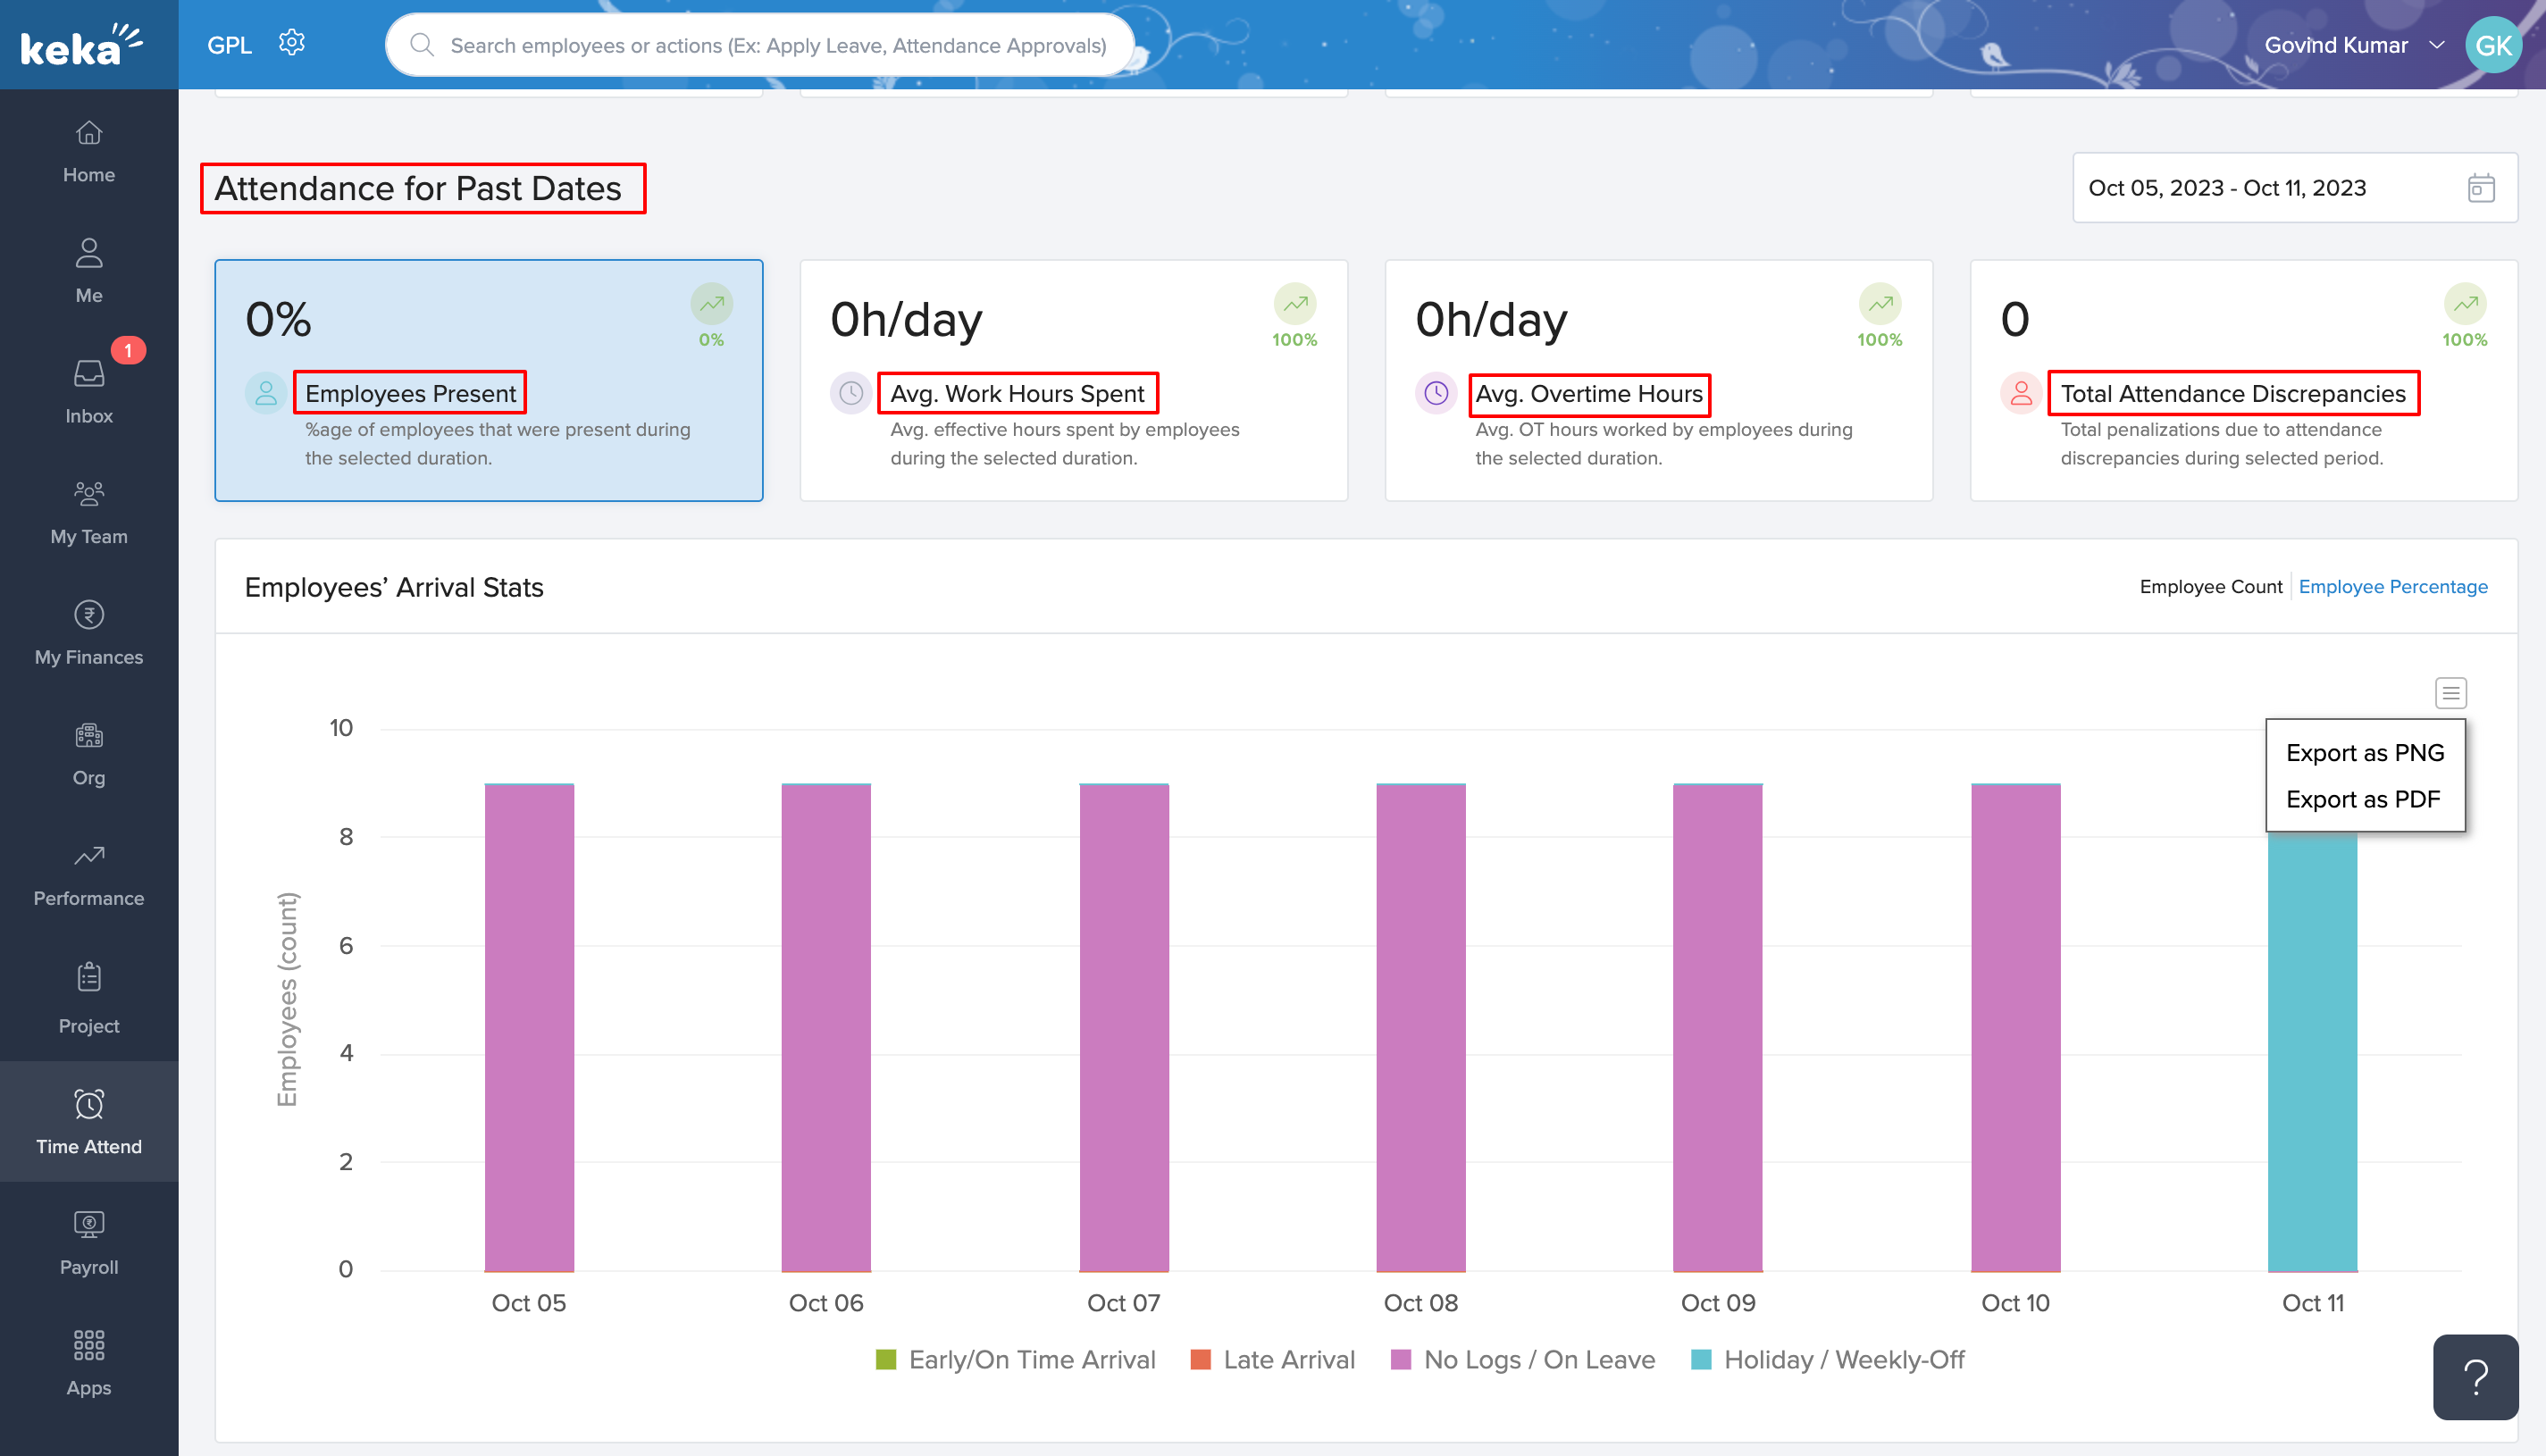
Employees Present: This displays the percentage of employees who were in attendance, supported by graphs that break down employee arrival stats and work-from-home figures.
Average Work Hours Spent: This shows the average number of effective work hours put in by employees. The information is presented in both numerical data and graphical forms.
Average Overtime Hours: Get the average number of overtime hours worked by employees. The graph offers a visual representation of this.
Total Attendance Discrepancies: This section shows the number of attendance issues during the selected time range.
The cards also indicate whether there's an increase or decrease in the numbers compared to a previous period. Plus, you can export all graphs in PDF or PNG formats.
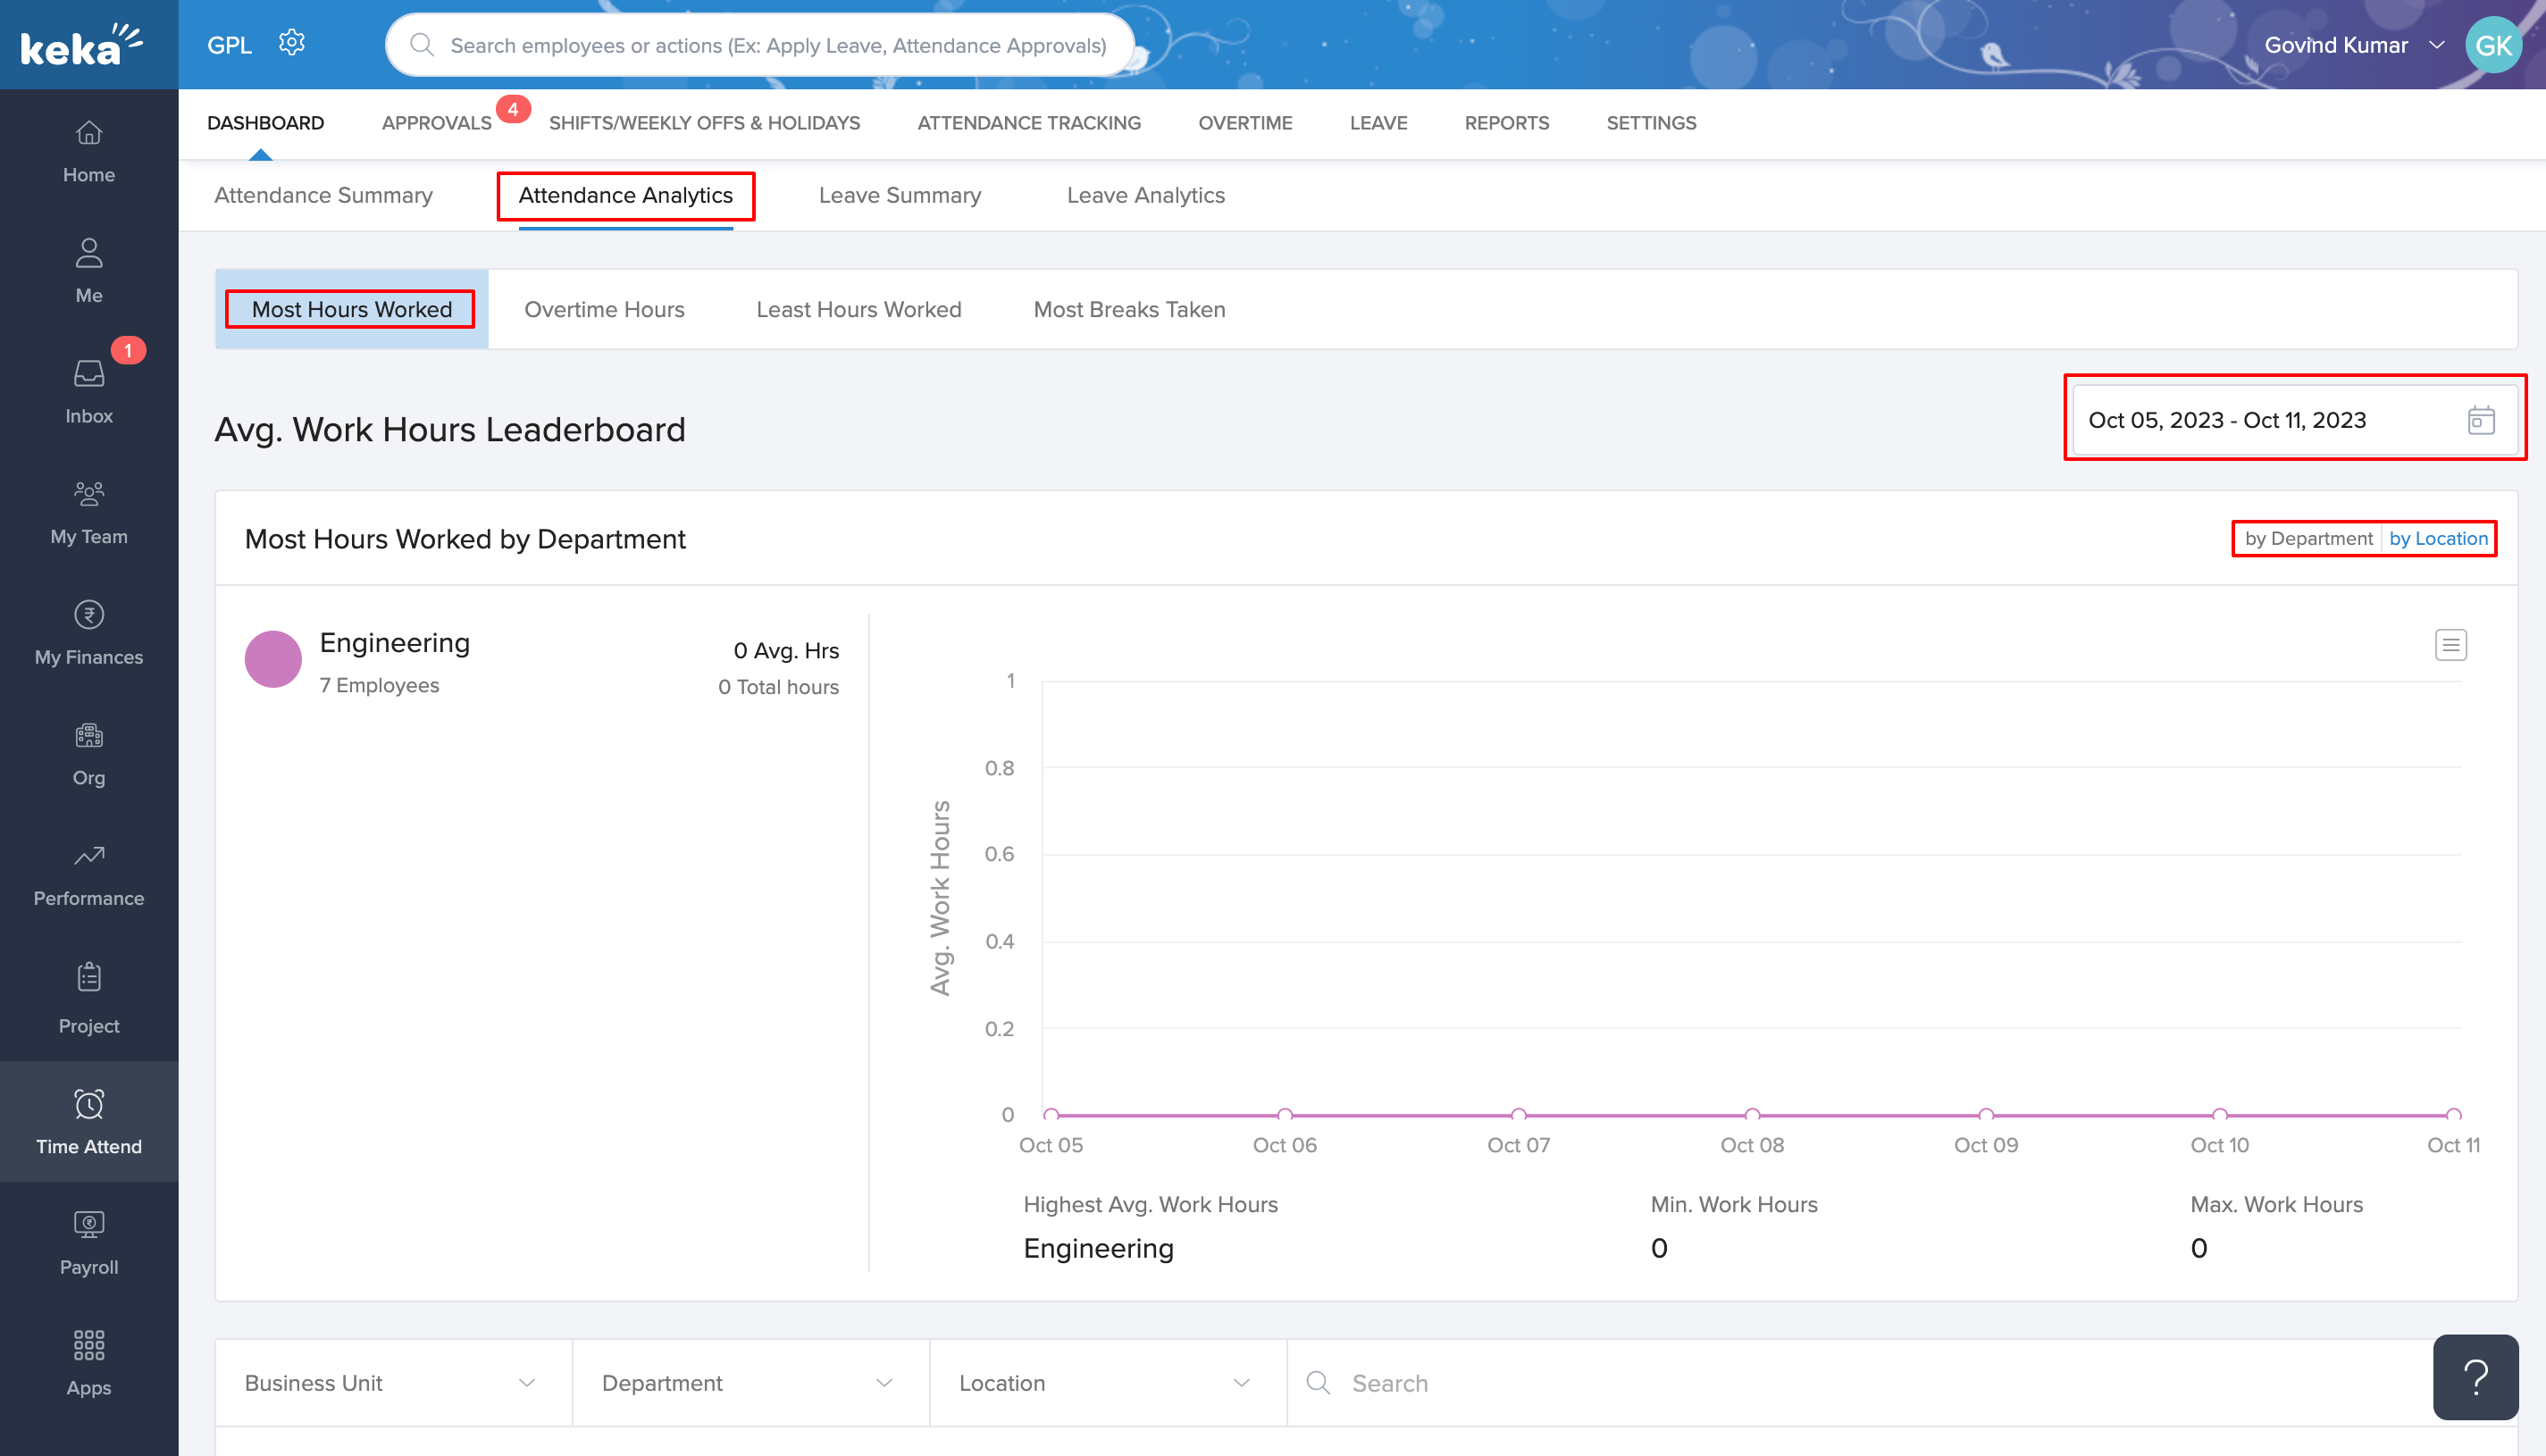
Attendance Analytics
Most Hours Worked
This displays an Average Work Hours Leaderboard sorted by departments or locations. An accompanying graph provides minimum and maximum work hours across different departments. Use the filters to get insights into specific business units, departments, and locations.
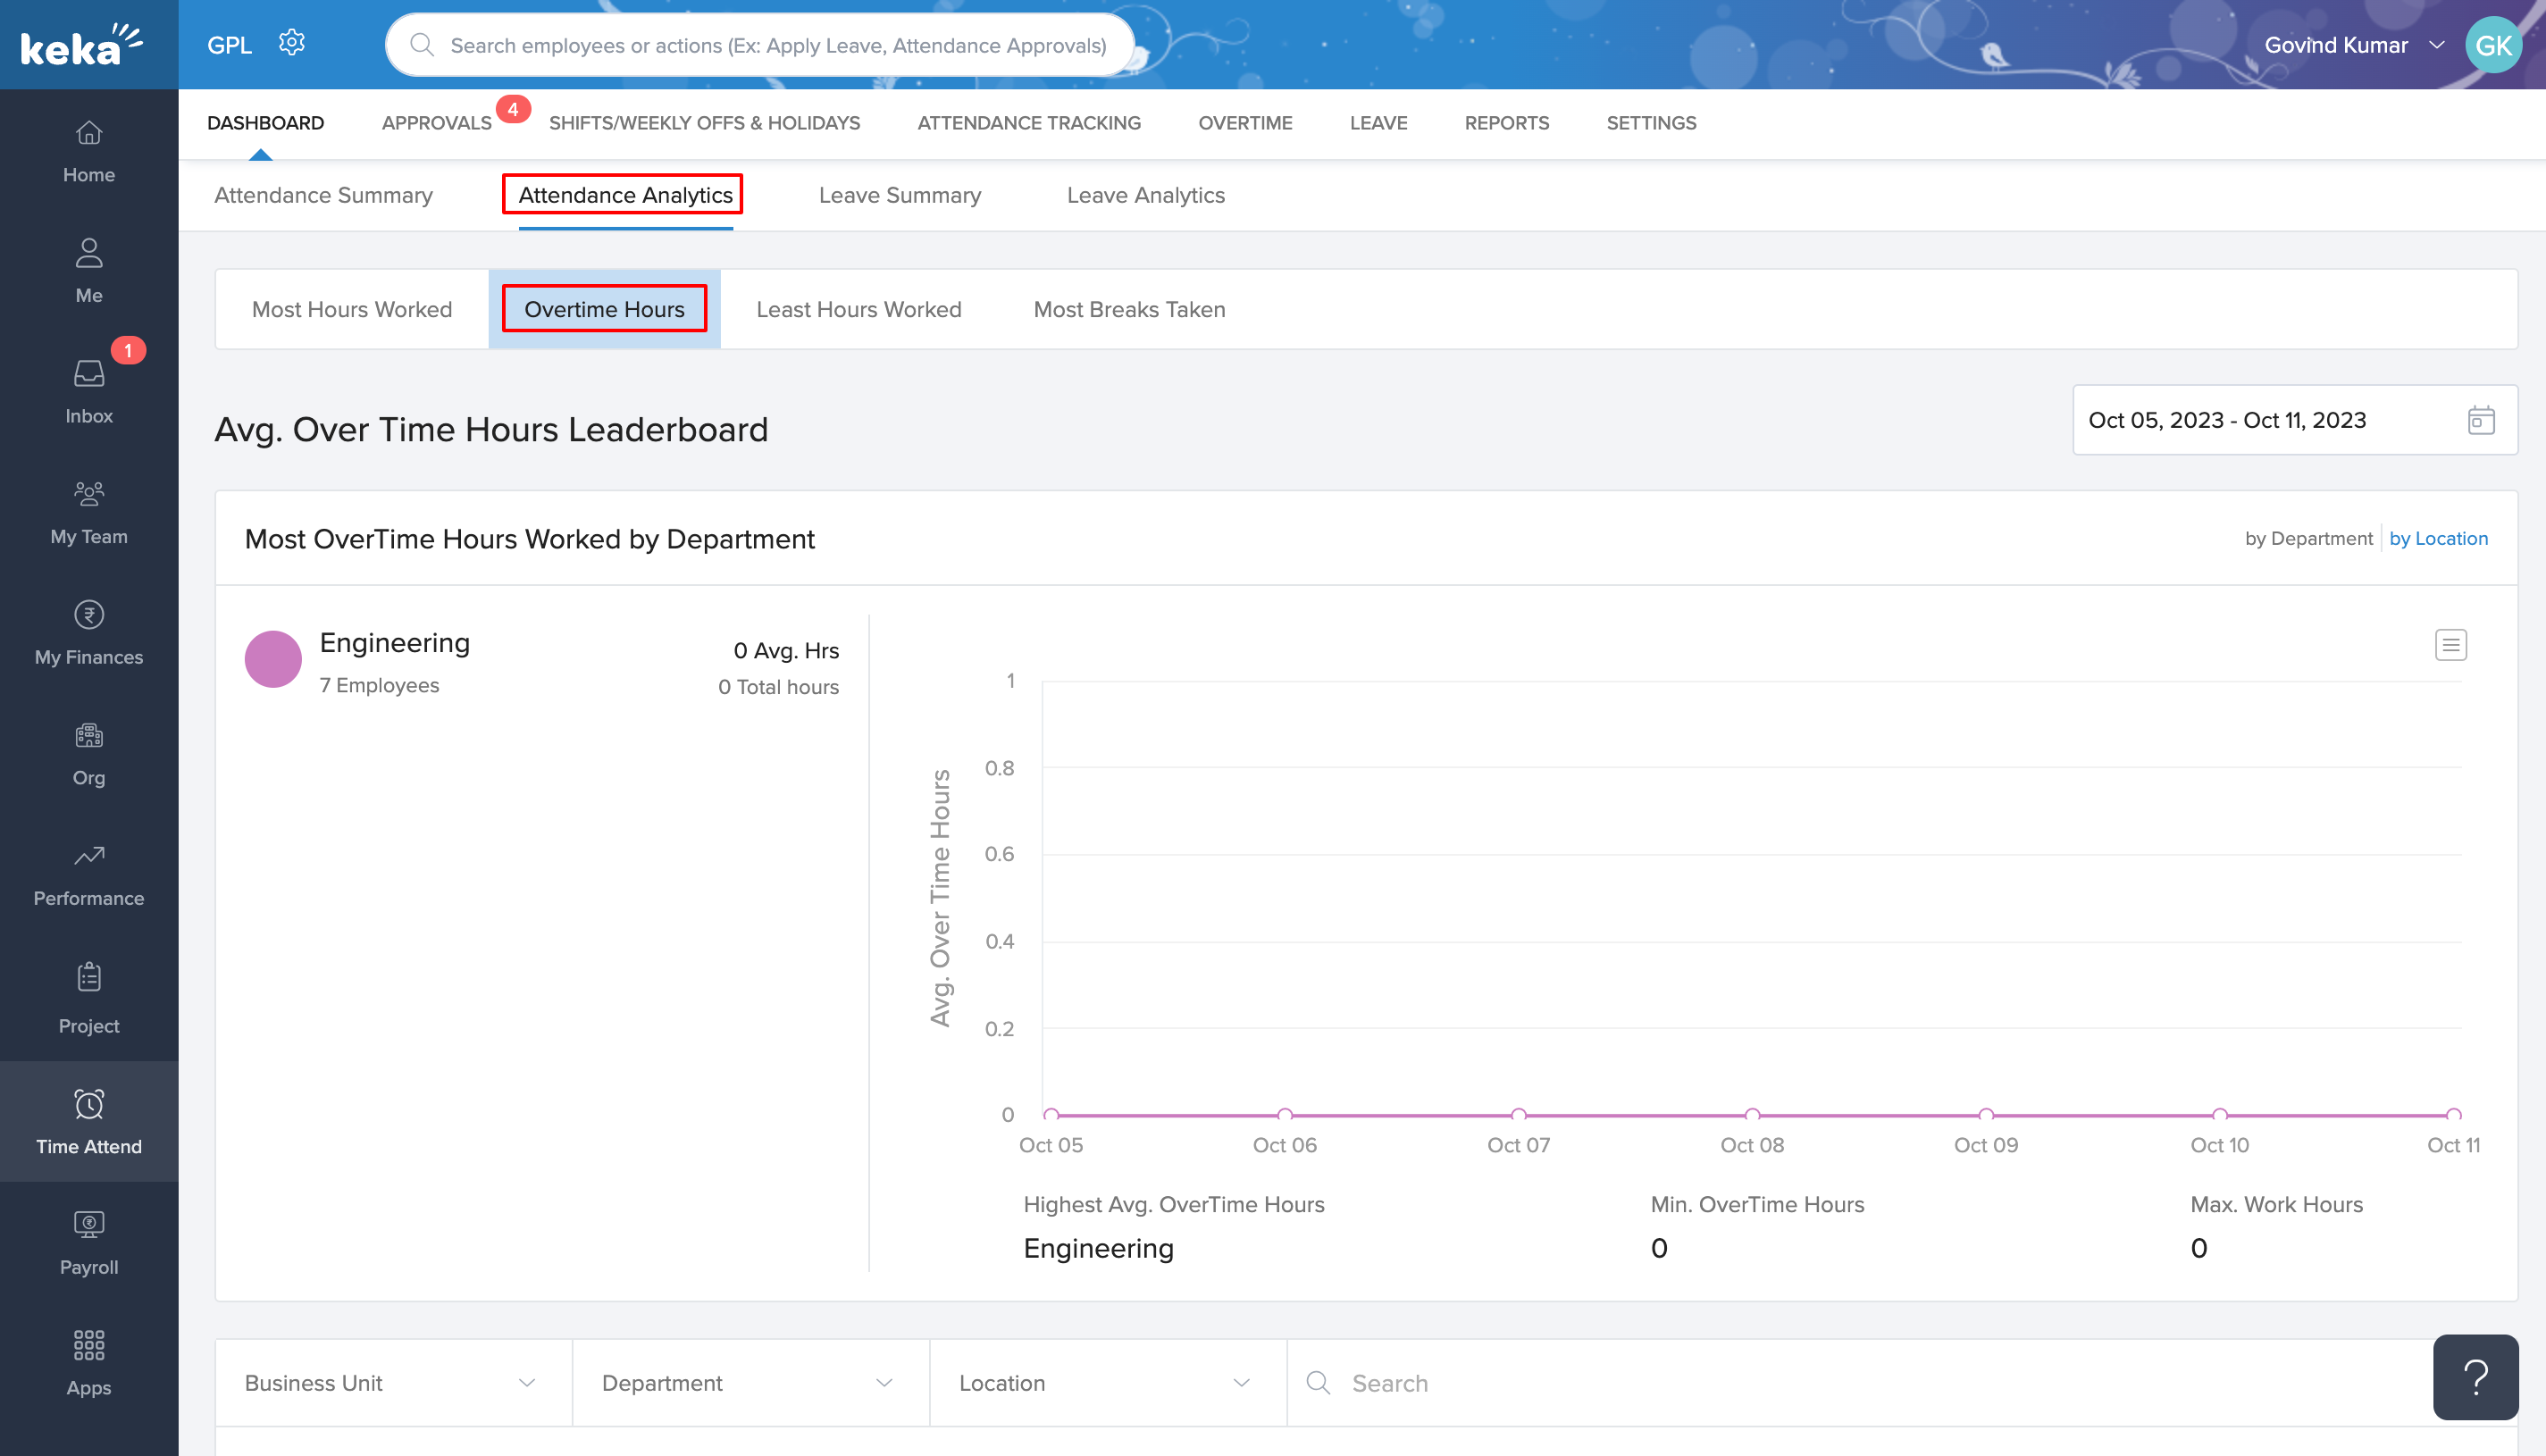
Overtime Hours
Here, you'll find an average overtime hours leaderboard along with a graph that shows the minimum and maximum overtime hours across departments.
Work hours shortage
This section is the opposite of the Most Hours Worked and provides an Average Least Work Hours Leaderboard.

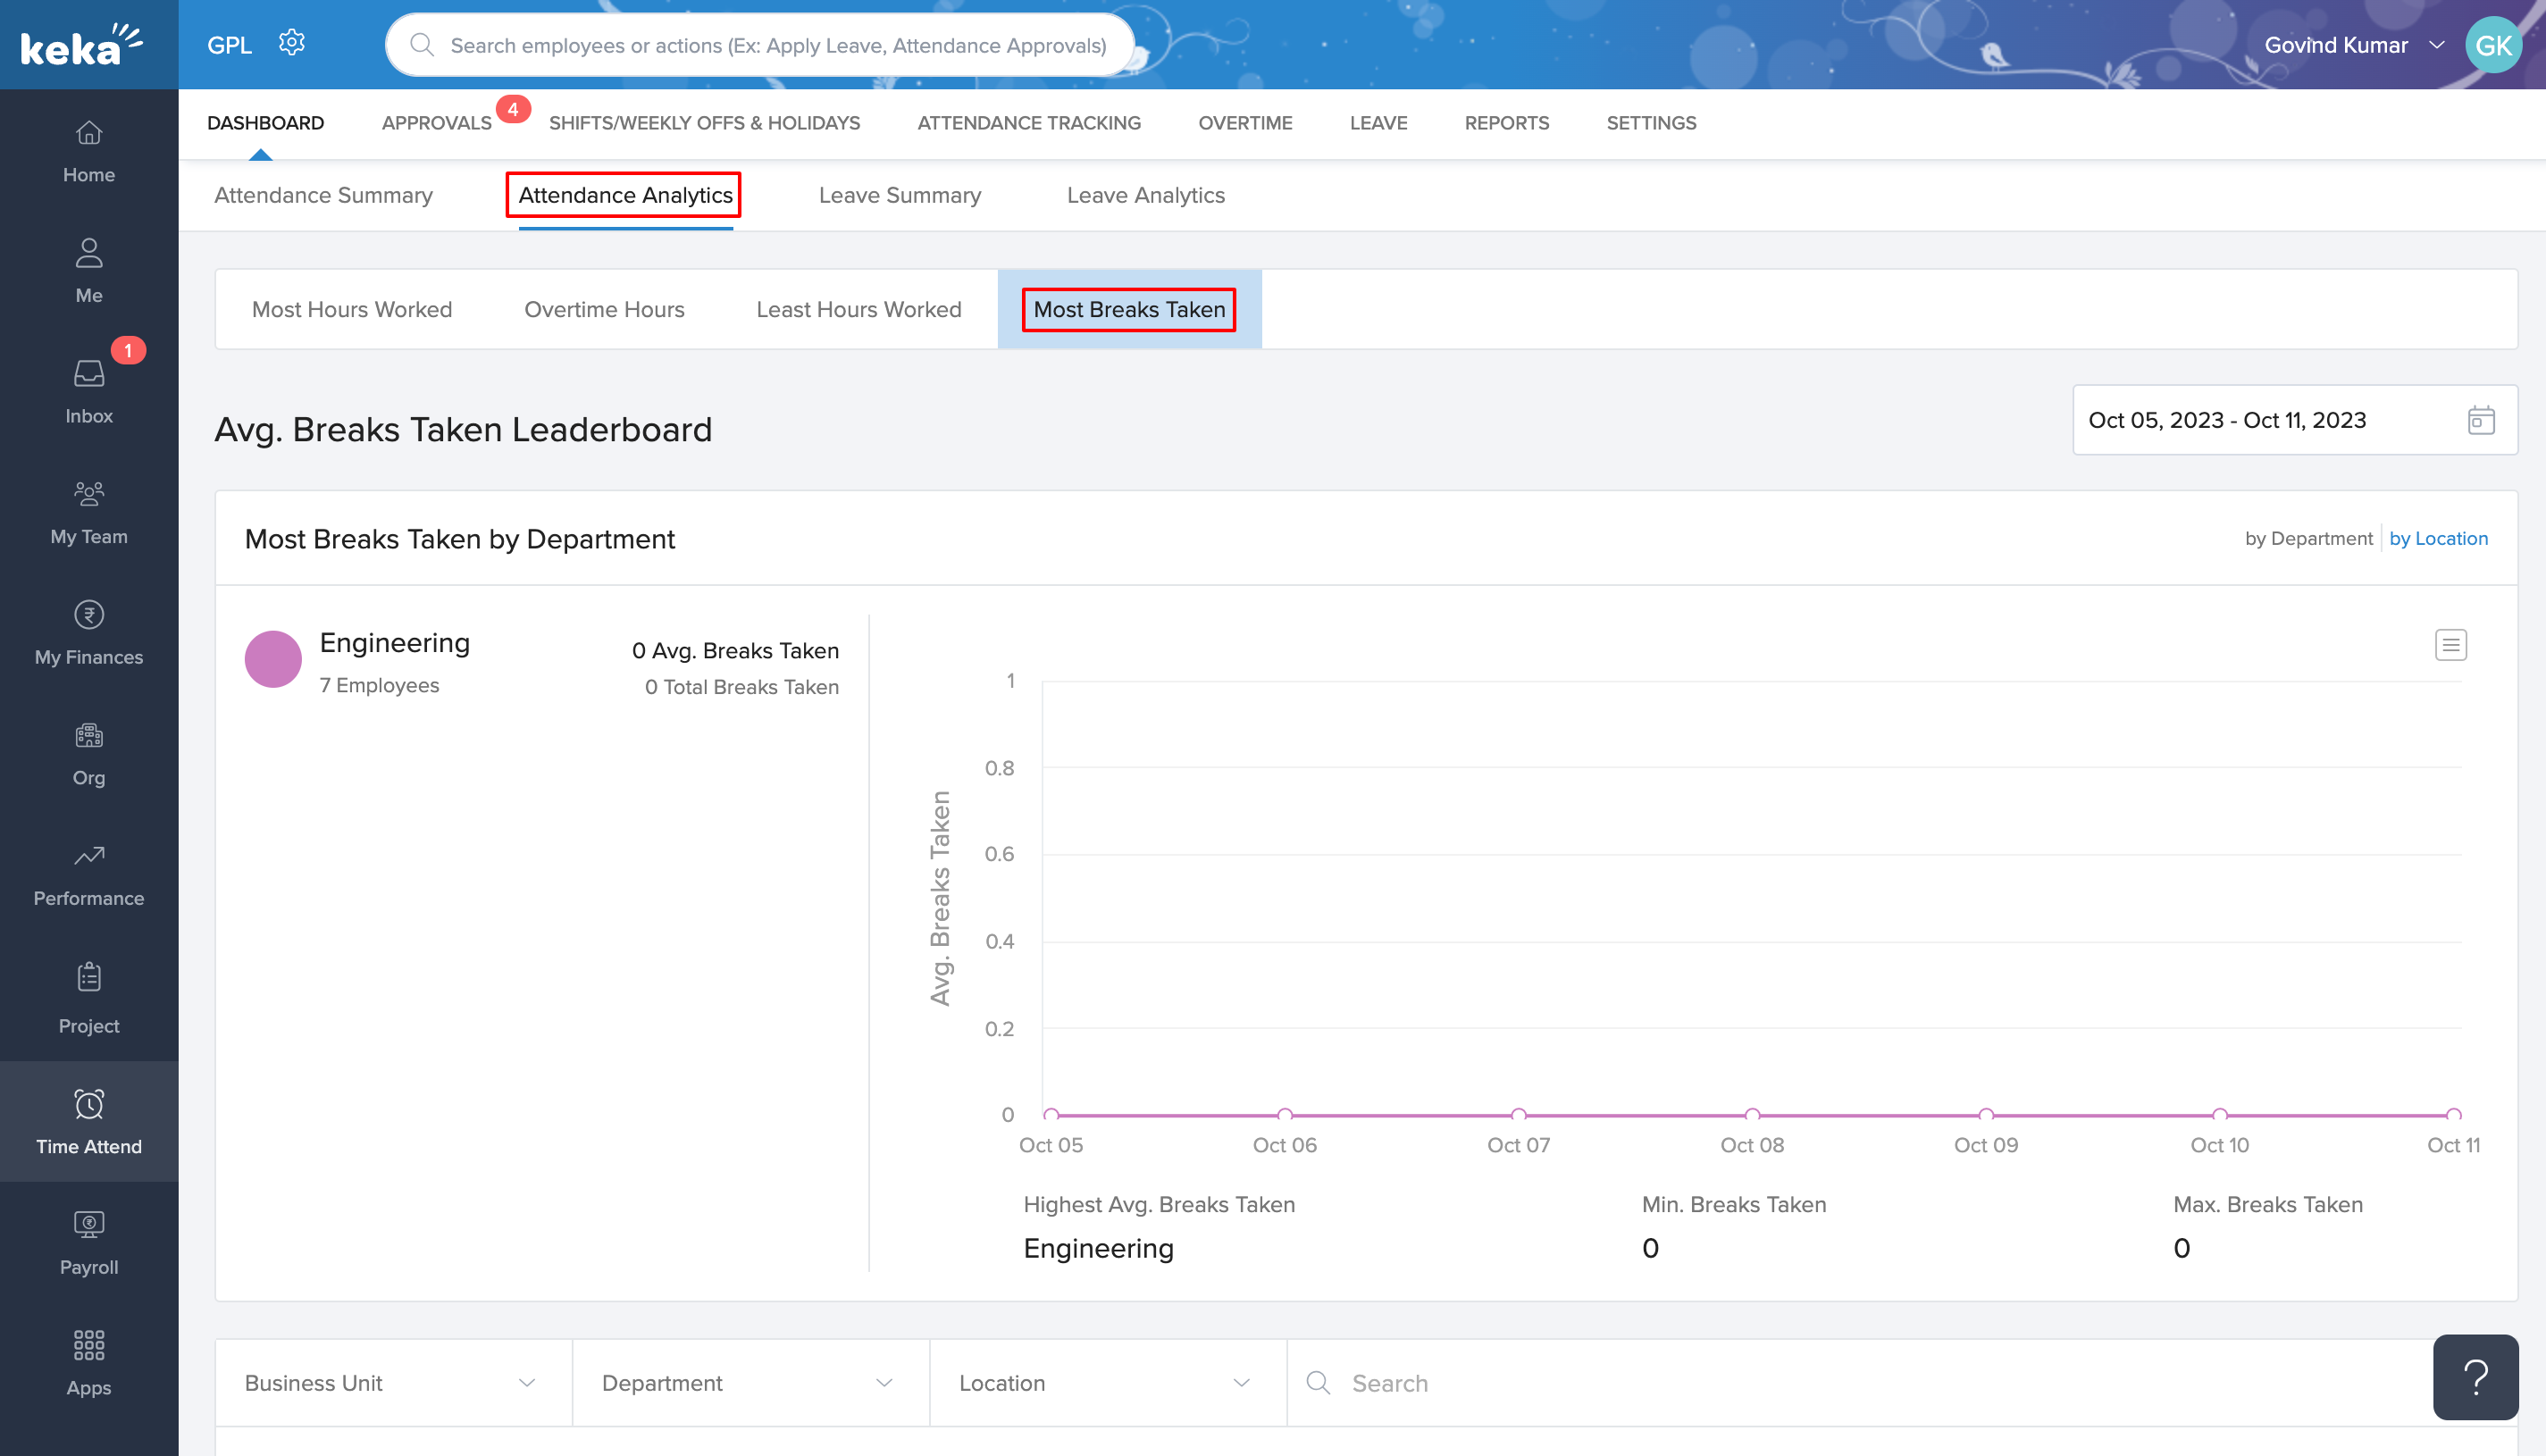
Most Breaks Taken
This section offers an Average Breaks Taken Leaderboard, and as the name suggests, it tells you who takes the most breaks.
Leave Summary
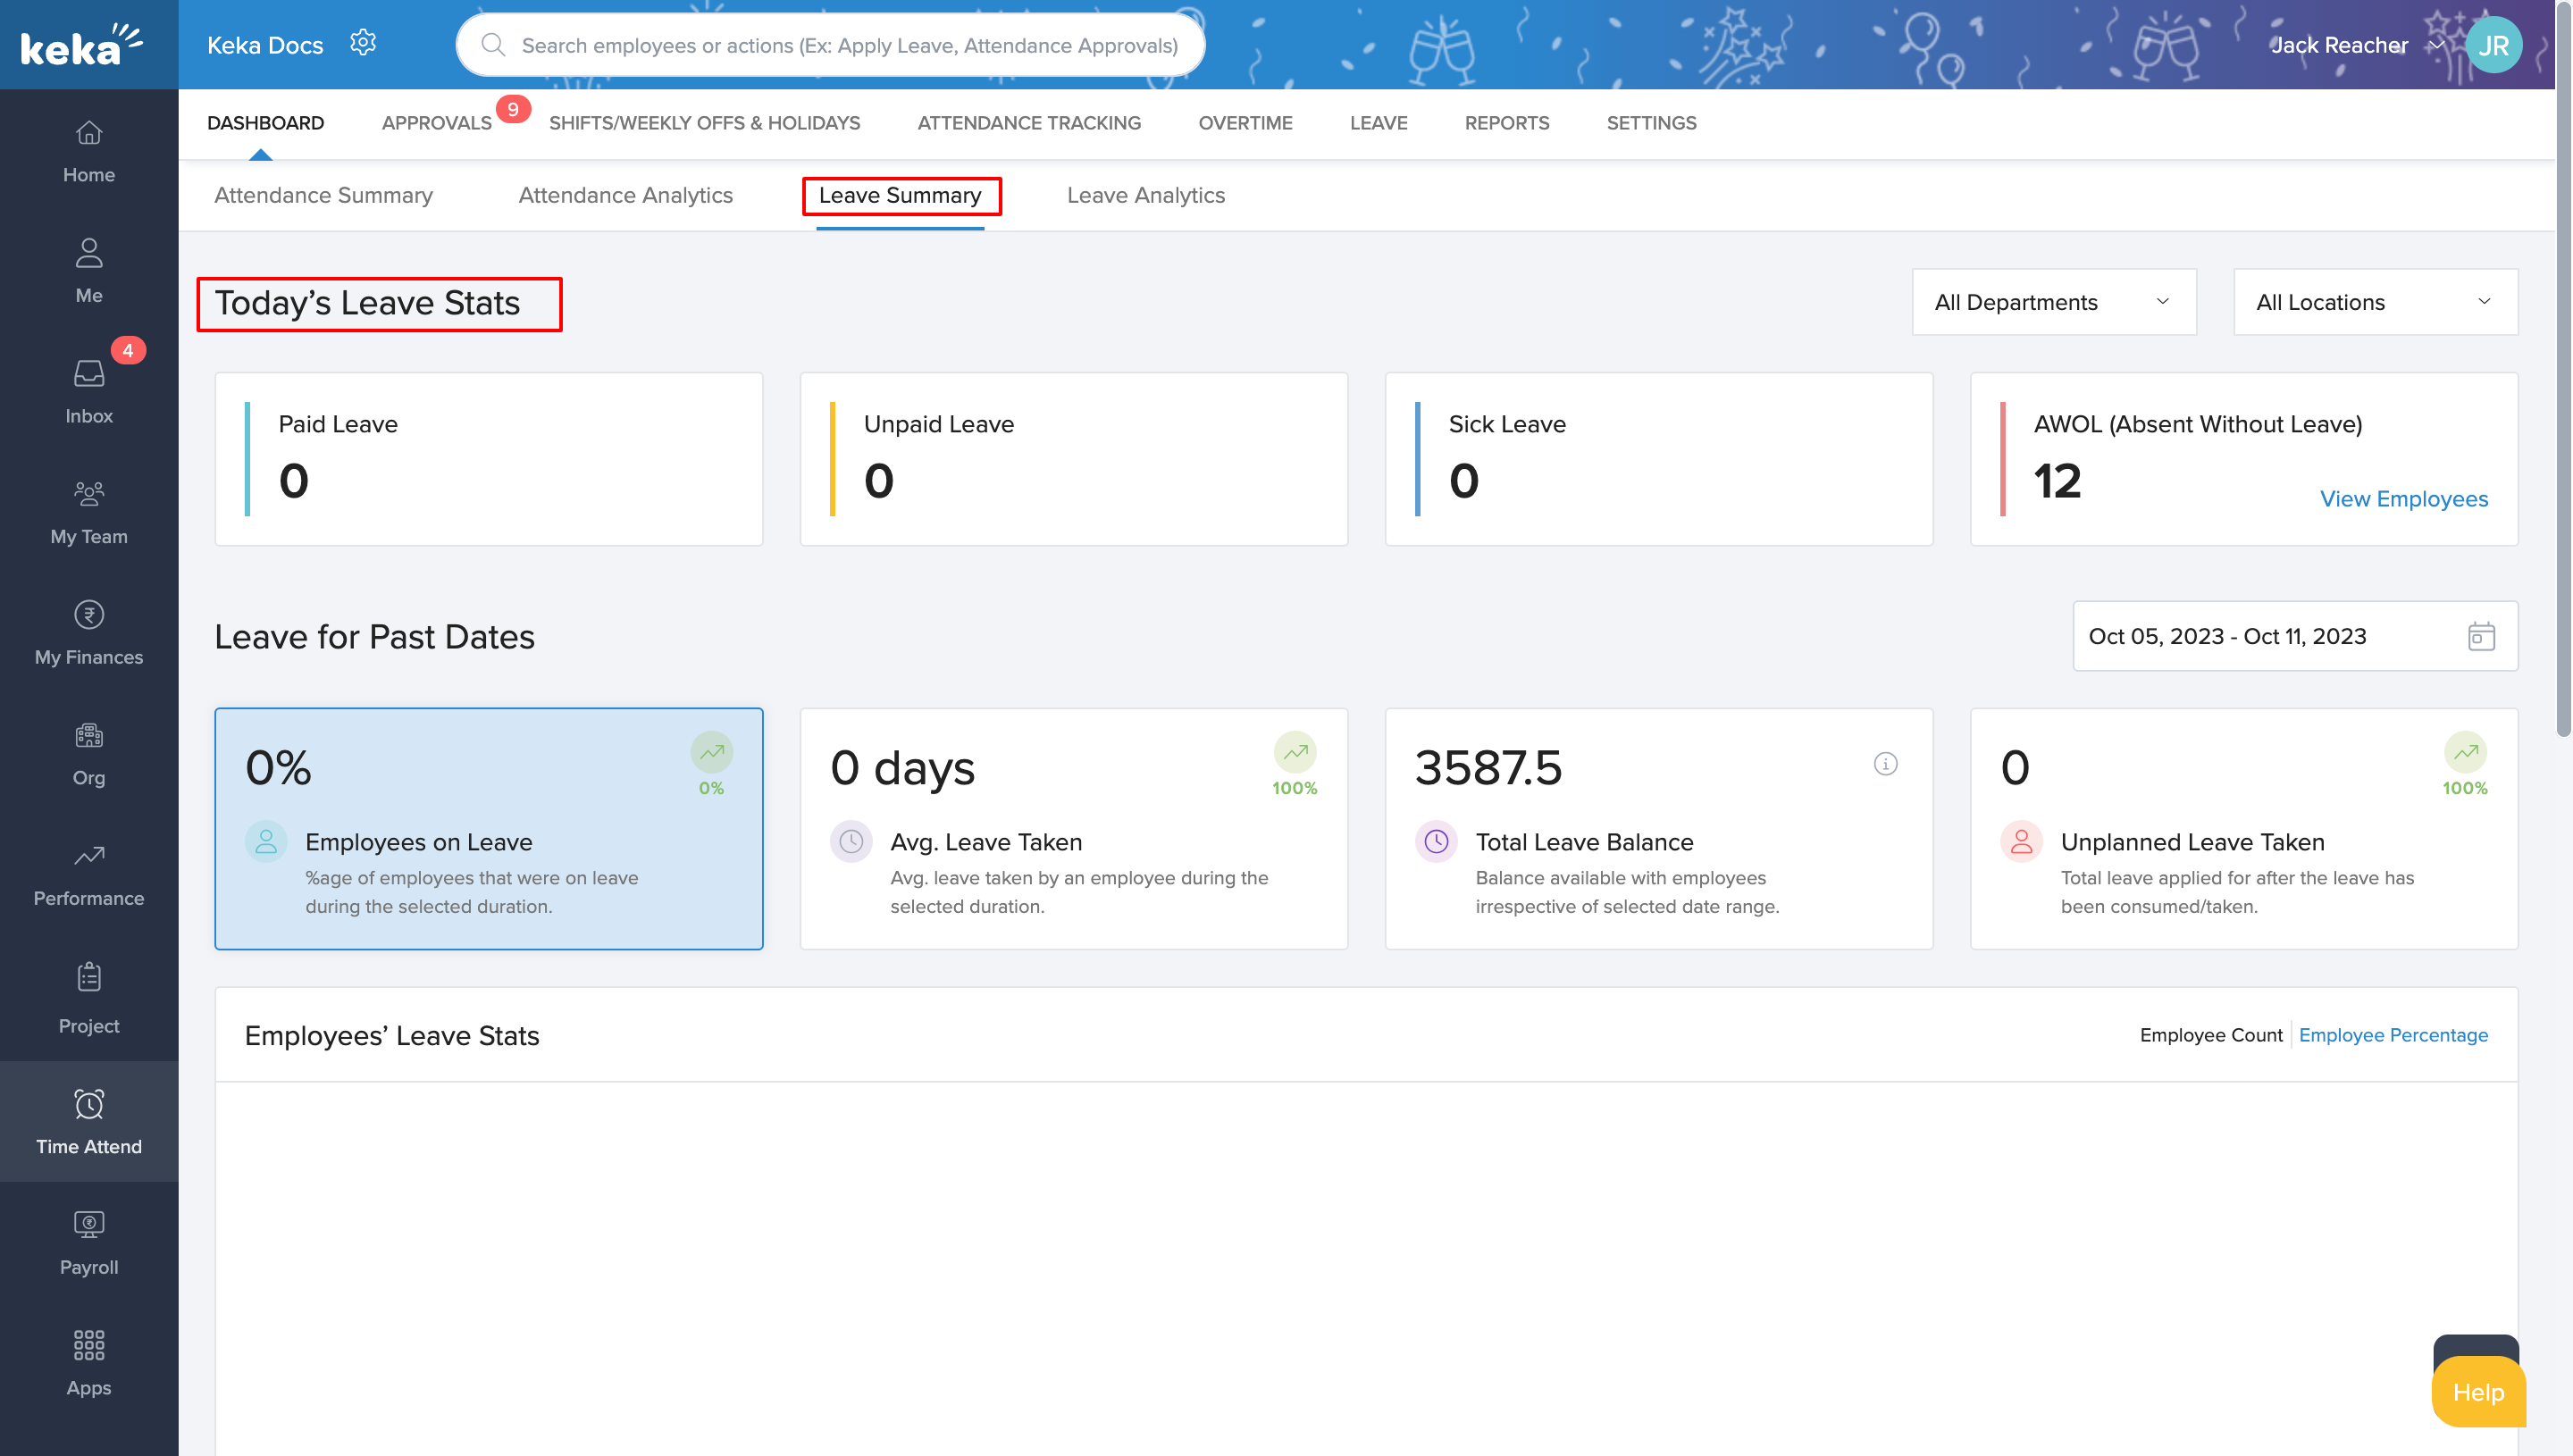
Today's Leave Stats
This part gives you an overview of all the different types of leaves taken today, across your chosen departments and locations. Click on "view employees" for specific sections for more information.
Leave for Past Dates
Here, you can see graphical reports for various leave management parameters.
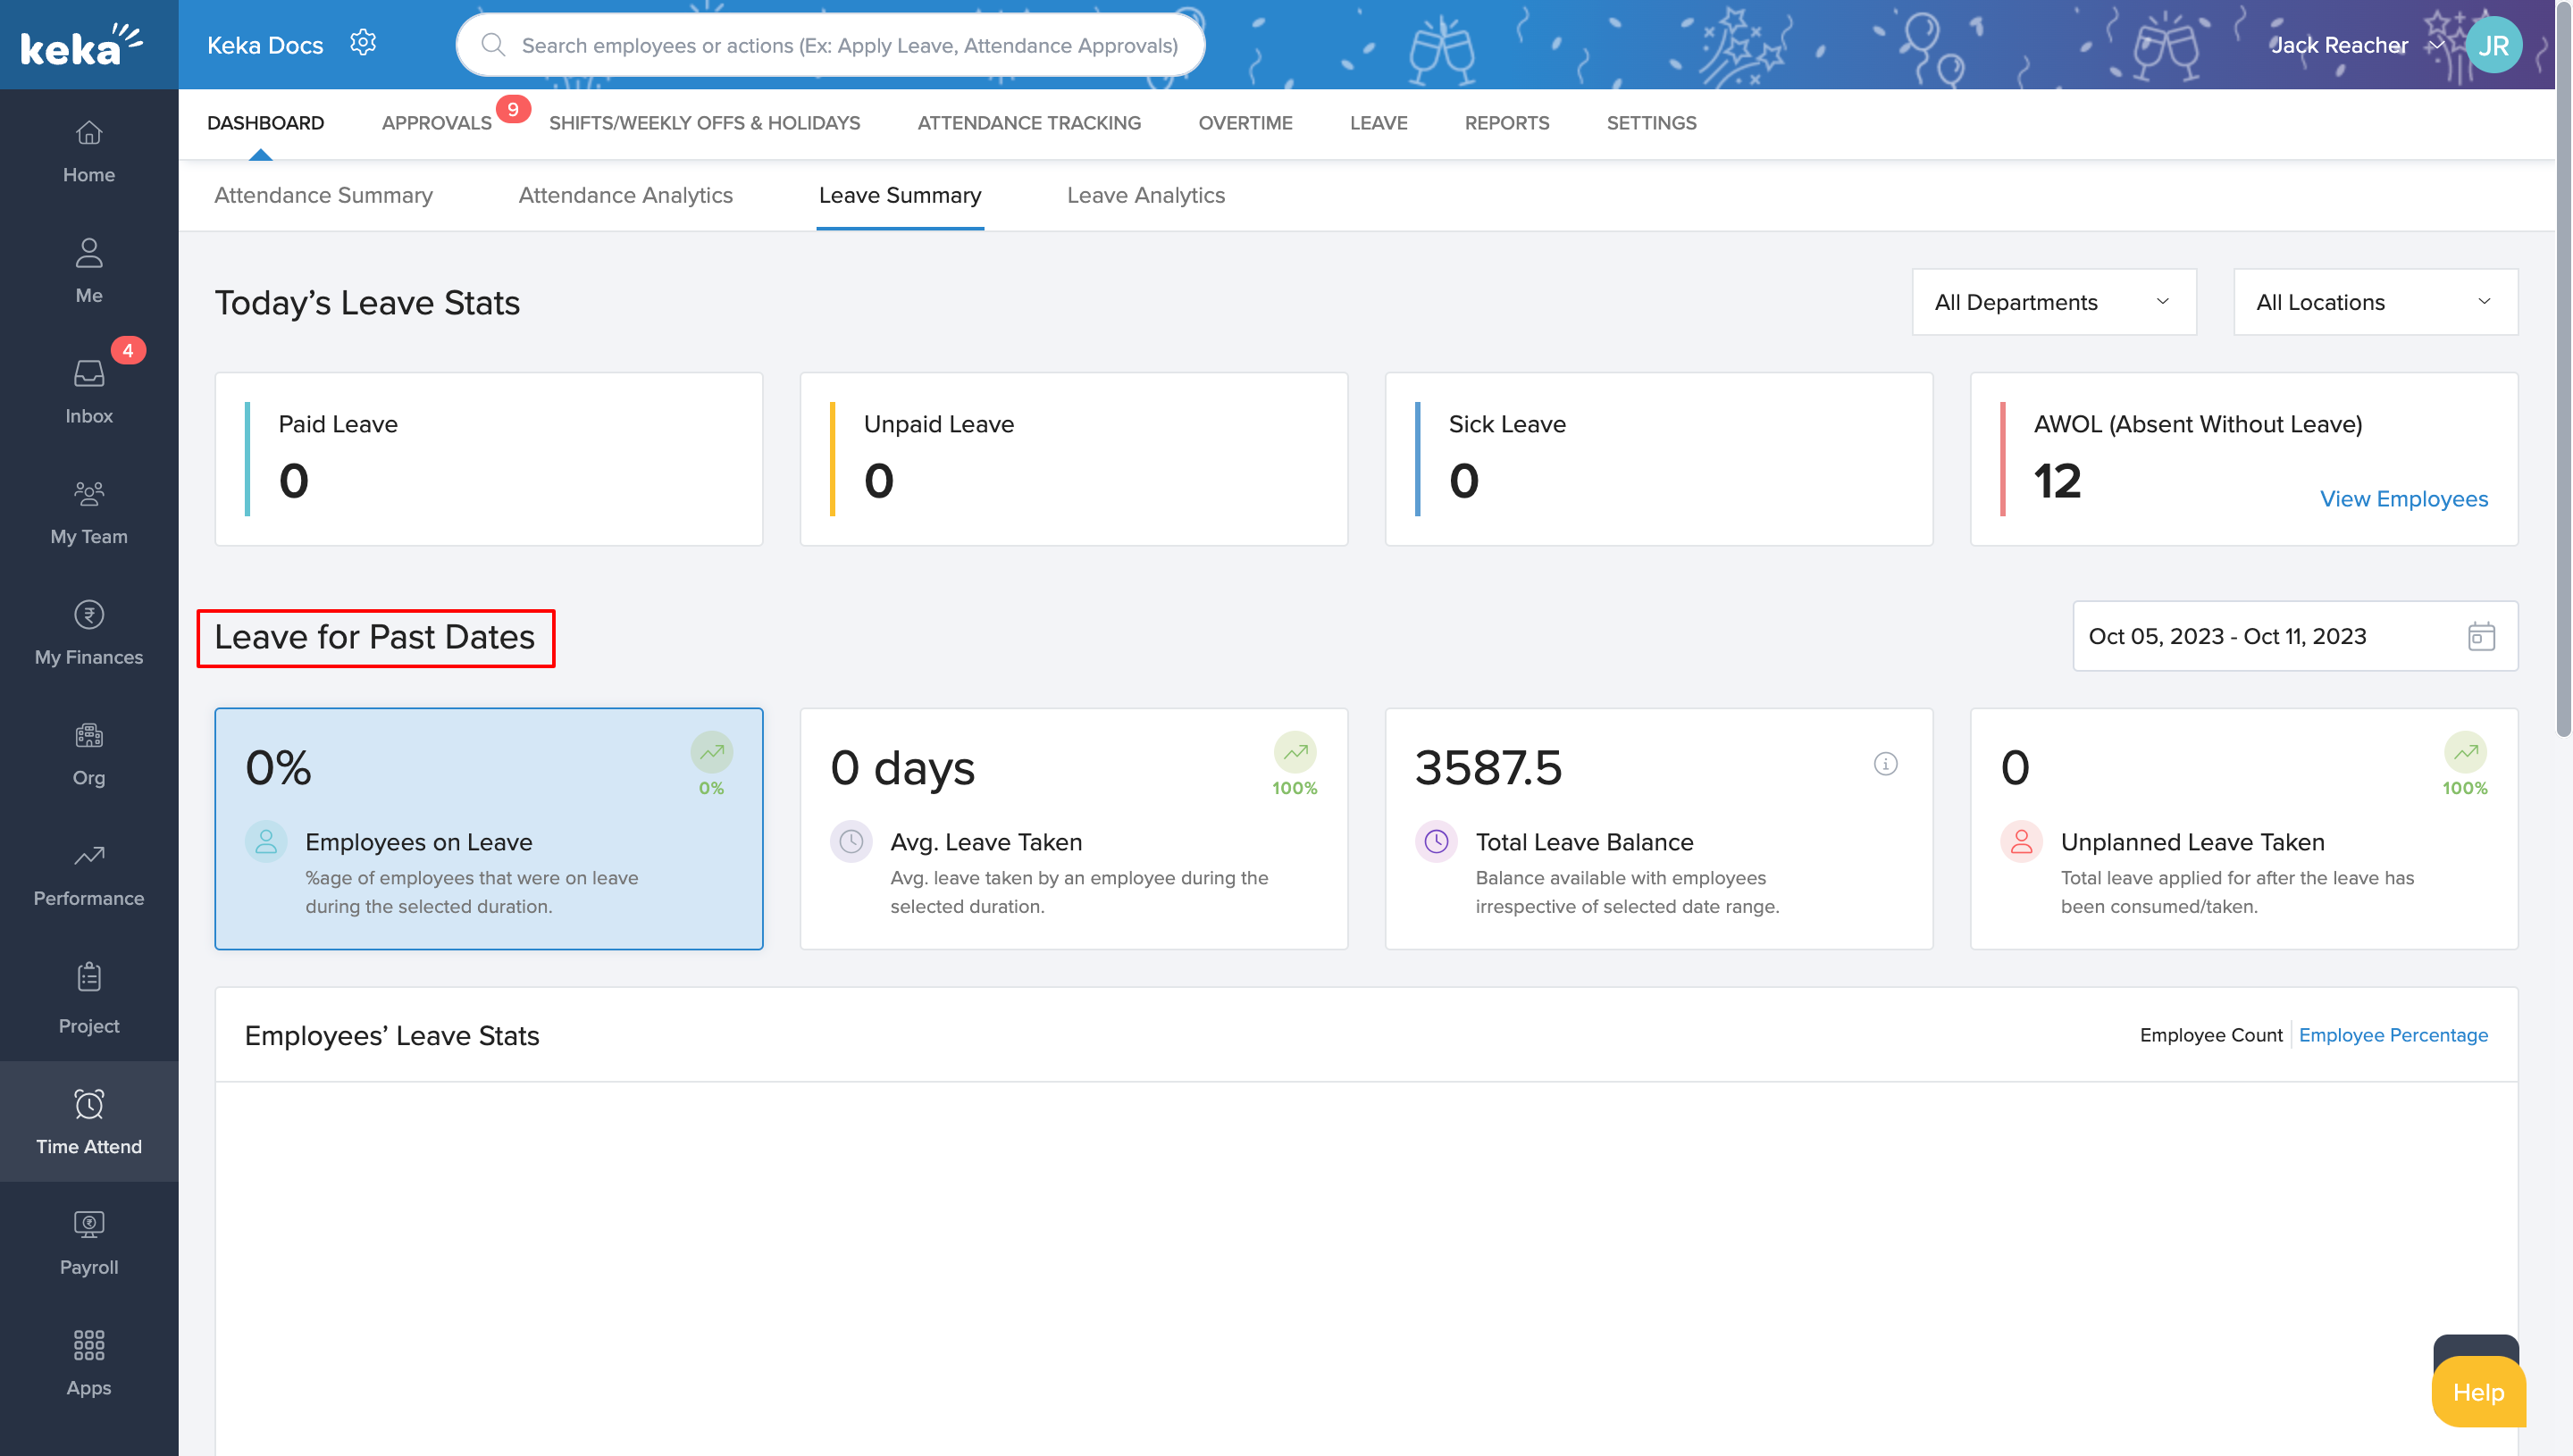
Employees on Leave: A percentage and graphs tell you how many employees were on leave during your selected duration.
Average Leave Taken: This tells you the average number of leaves taken by an employee during the selected time range, supported by a graph.
Total Leave Balance: Check the overall leave balance across your workforce.
Unplanned Leave Taken: This part reveals the total number of unplanned leaves taken during this period.
Each of these subsections is accompanied by graphs for visual understanding and can be exported for further use.
Leave Analytics
In this section, you'll get a deeper look into leave trends within your organization, just like you did with attendance analytics. Let's go through the main parts:
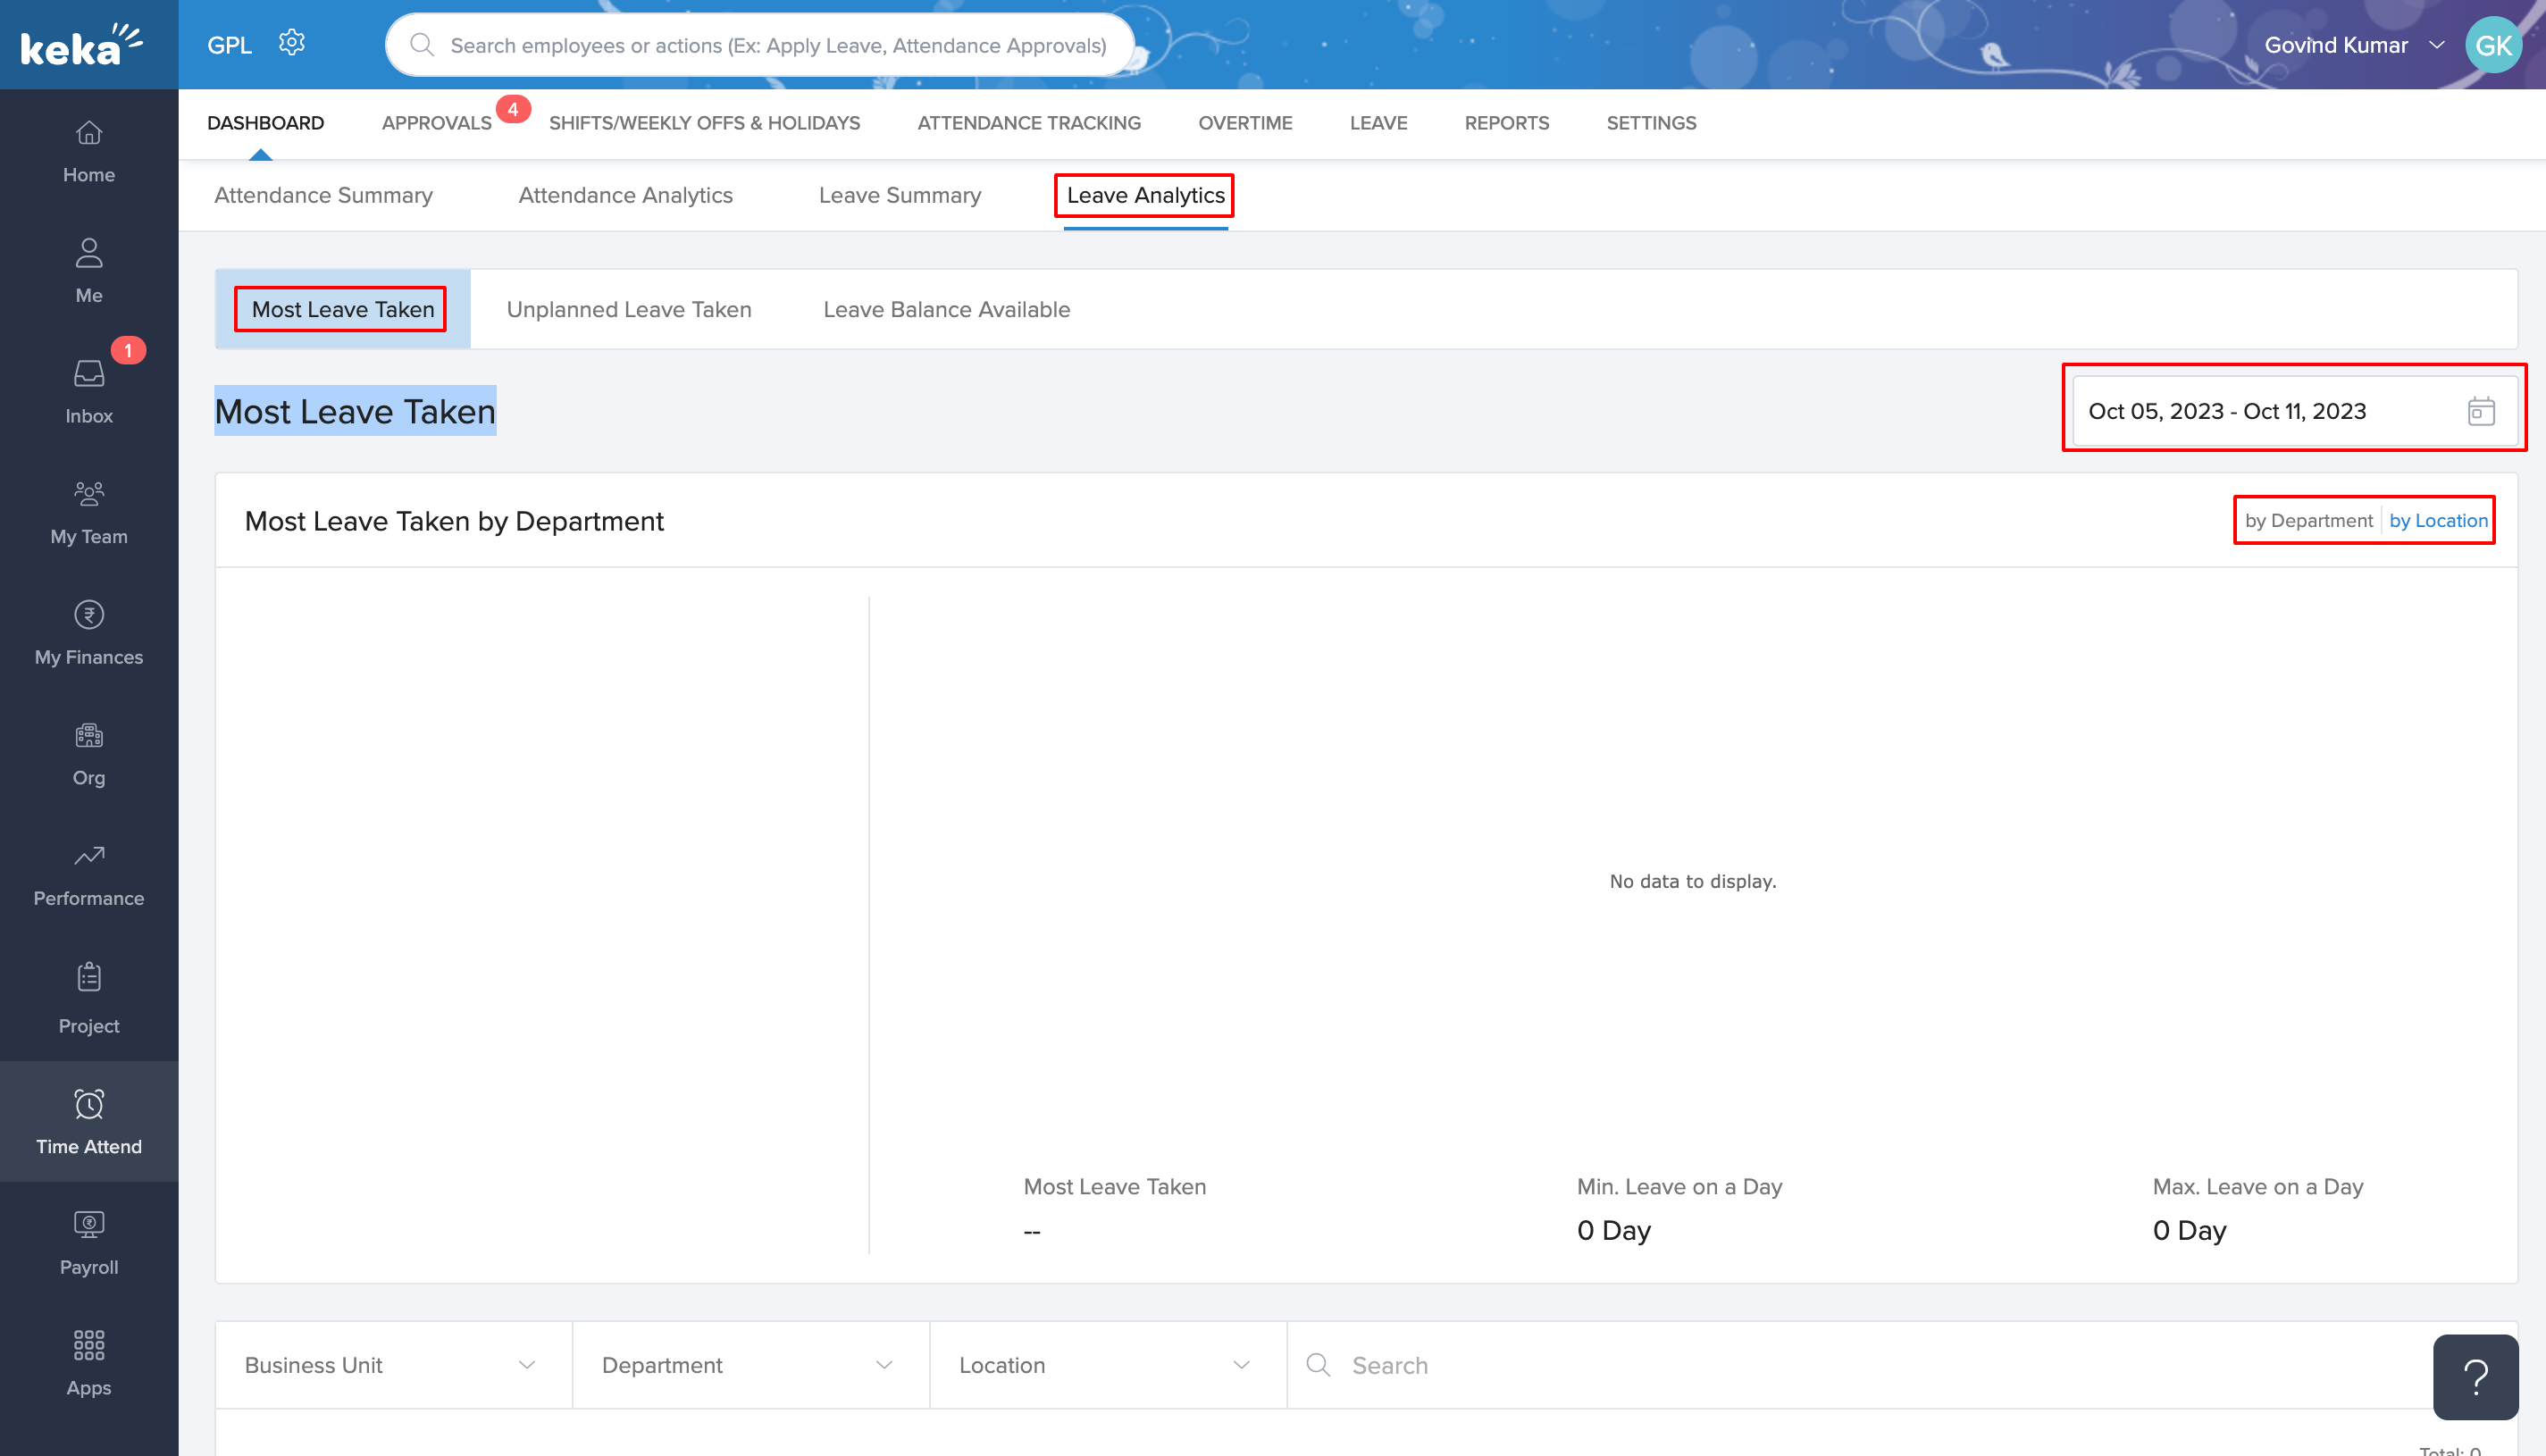
Most Leave Taken
Here, a leaderboard shows you which departments or locations have employees taking the most leaves. You'll also see a graph that provides minimum and maximum leave counts for different departments. If you want, you can download this graph as a PNG or PDF.
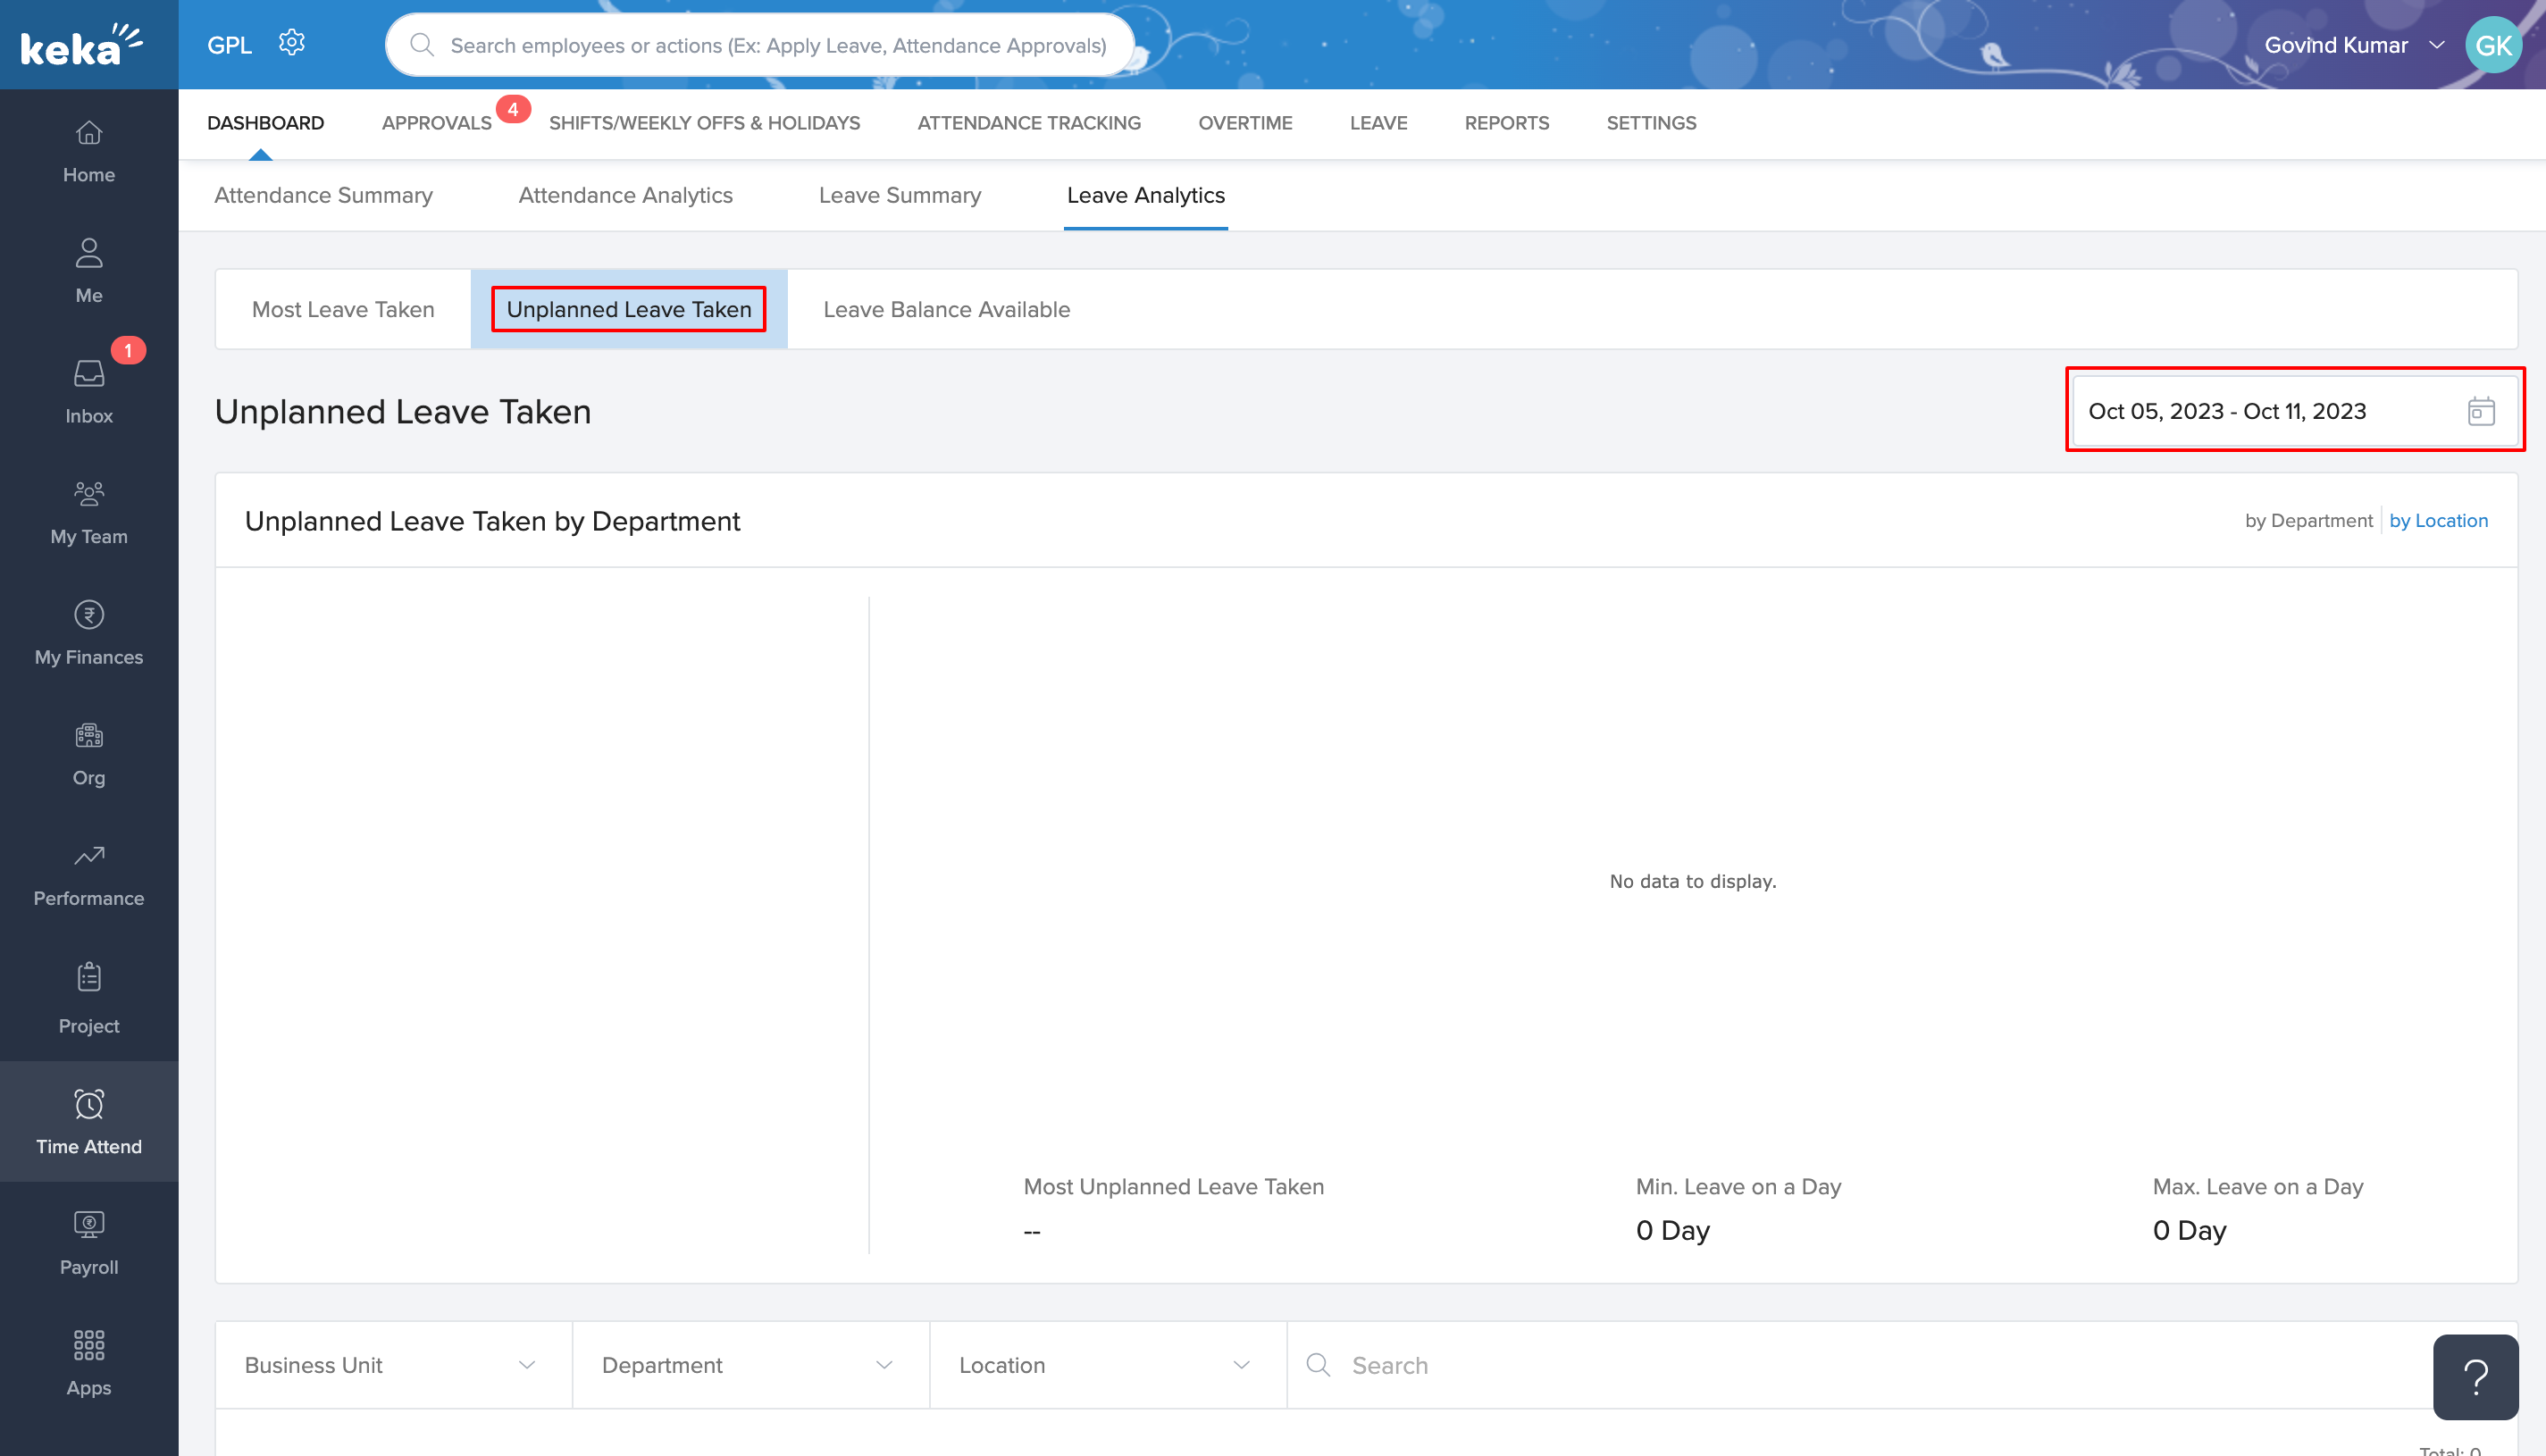
Unplanned Leave Taken
This leaderboard focuses on unplanned leaves—those taken without prior notice. A supporting graph shows the frequency of such leaves across different departments, and yes, this graph is also exportable.
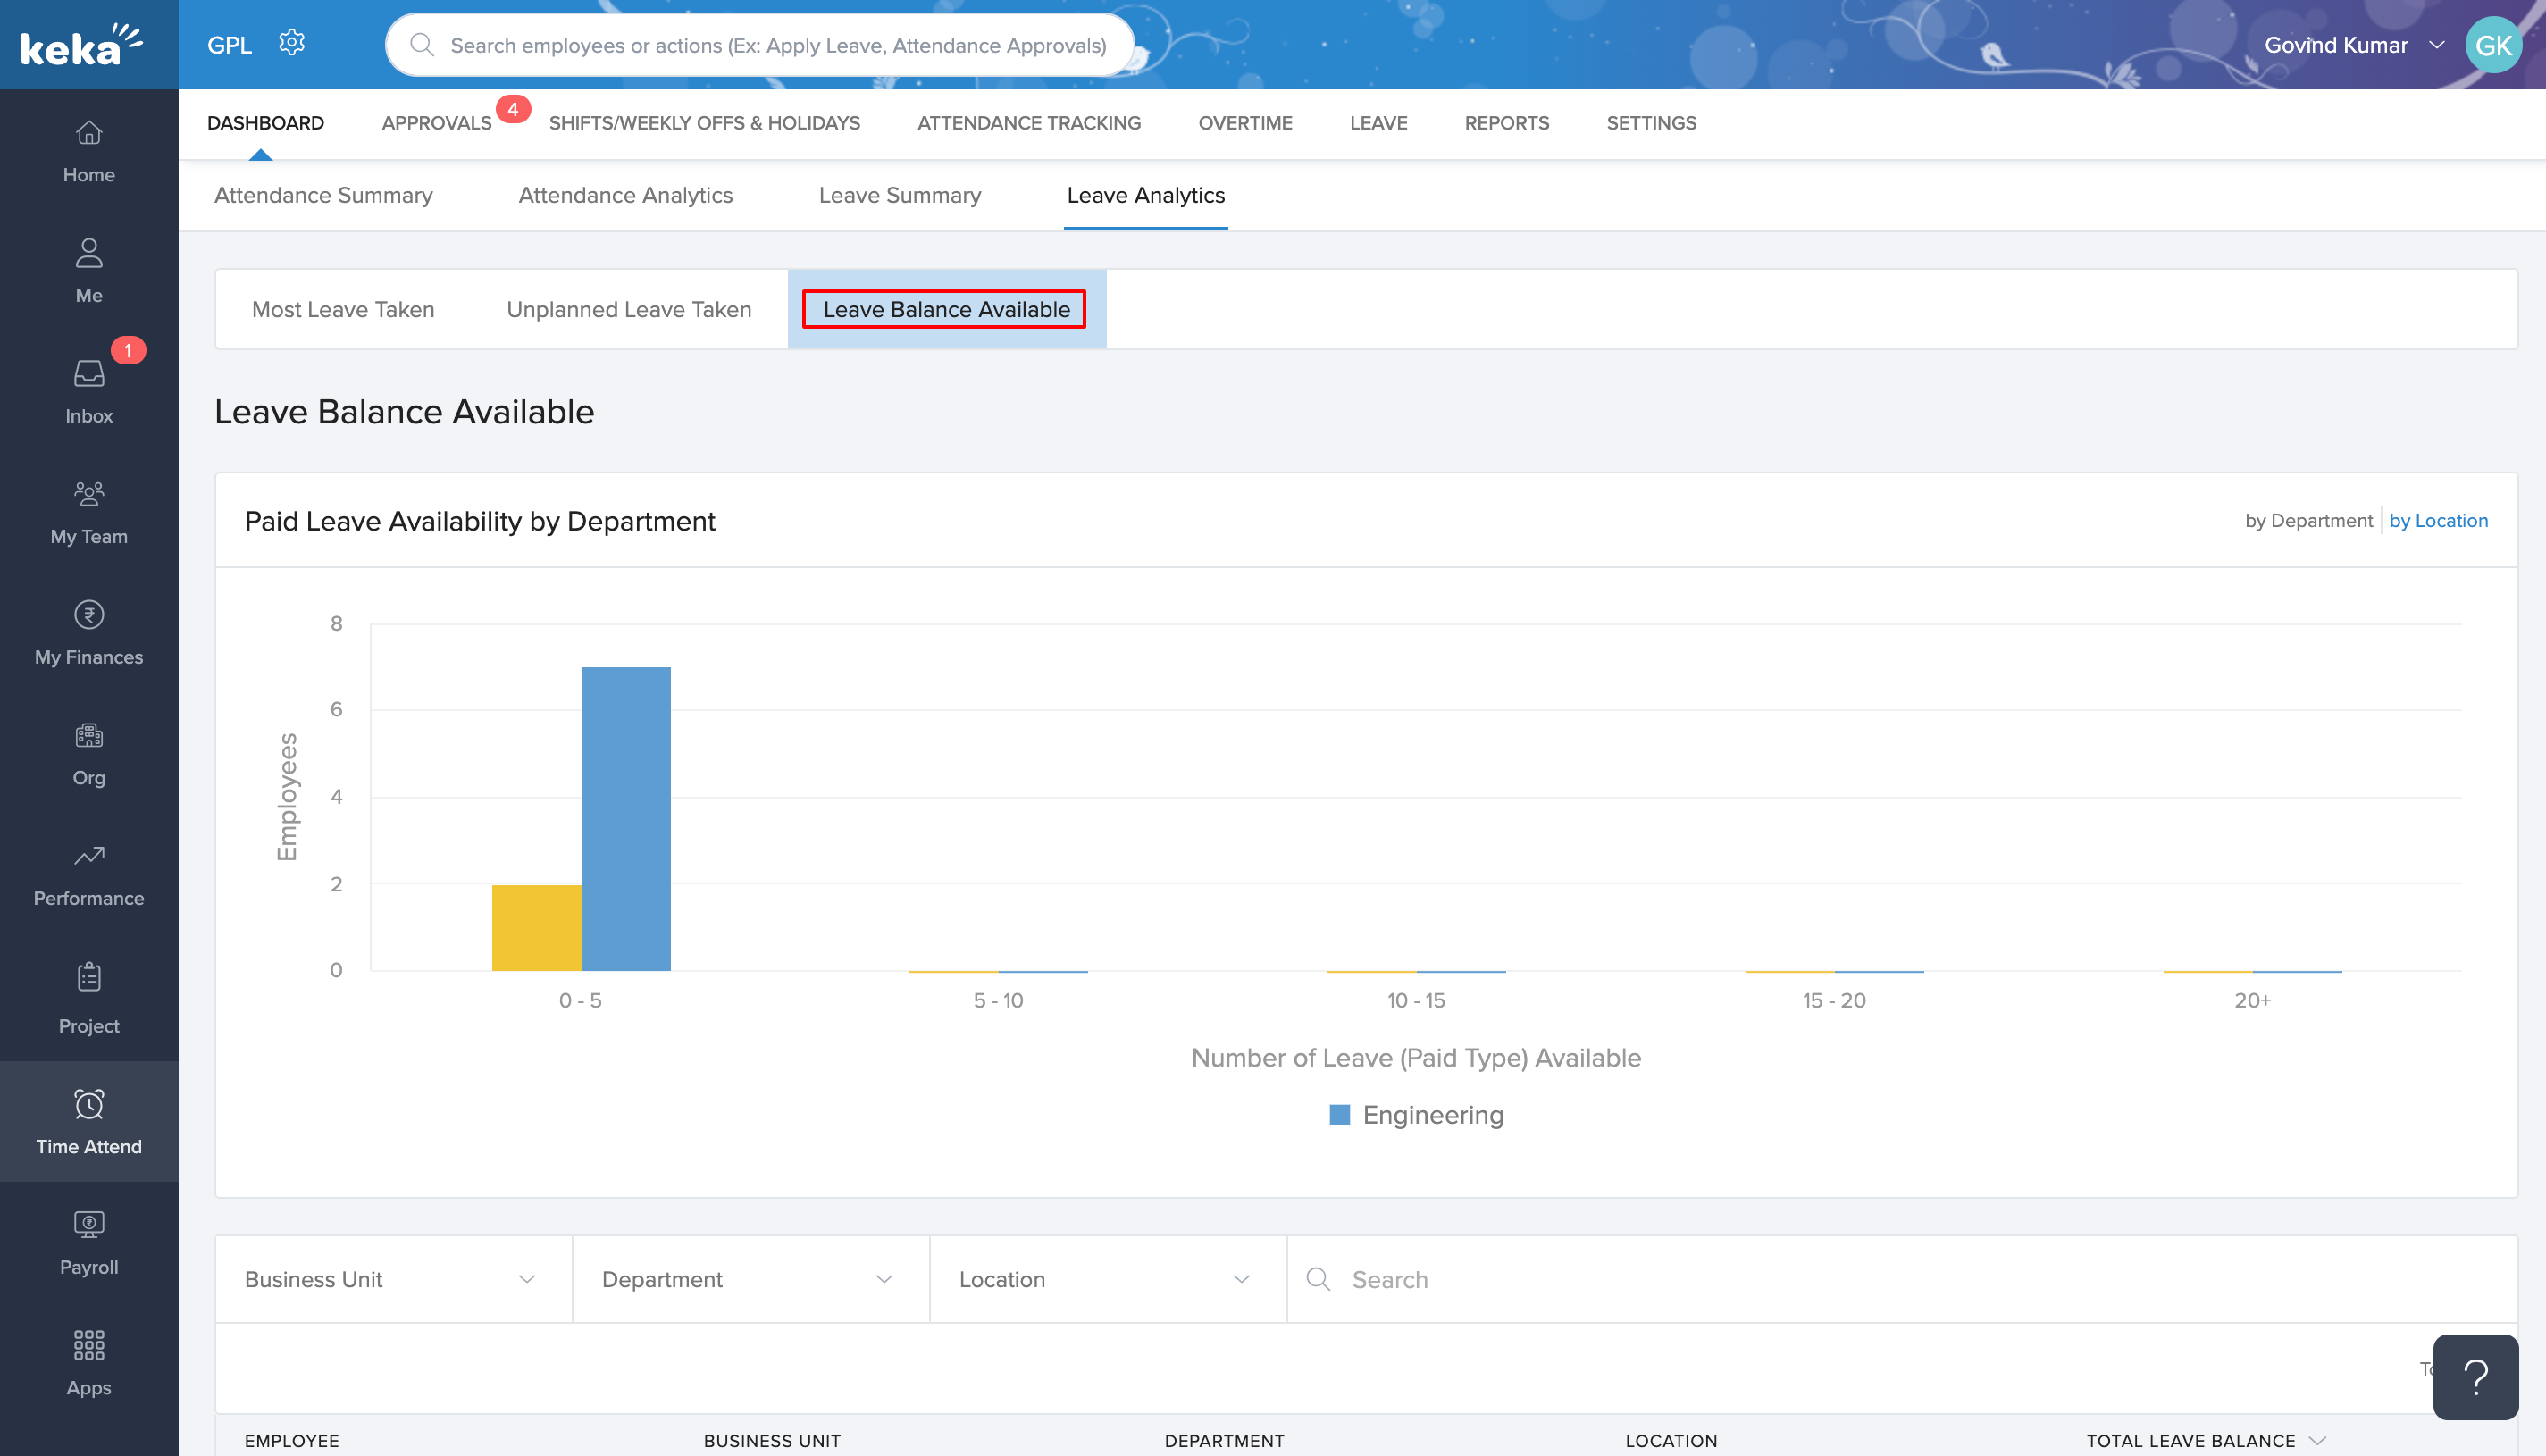
Leave Balance Available
This shows you the departments with the most remaining leaves, displayed both as a leaderboard and a graph. You can see how many leaves are left on average for employees in different departments.
Each of these sections allows you to further filter the data based on business unit, department, or location. You also have the option to export any of these graphs in PDF or PNG format for your records.