The Summary tab in Keka’s Helpdesk module offers a snapshot of your support operations. It displays real-time ticket metrics, performance KPIs, and category-level insights to help you understand how effectively your team is handling employee requests.
Use this view to monitor trends, identify delays, and fine-tune your support strategy.
Steps to Access the Summary Tab
Go to Helpdesk from the main left navigation.
You'll land on the Summary tab by default.
Overview of the Helpdesk Dashboard
Ticket Status Tiles
These give you a high-level summary of ticket activity.
Open Tickets: All unresolved tickets
Incoming Today: New tickets submitted today
Closed Today: Number of tickets resolved today
On Hold: Tickets temporarily paused
You’ll also see comparisons with yesterday’s data.
Ticket Analysis Widgets
Below the main counters, you’ll see key performance metrics:
Incoming: New tickets in the selected period
Closed: Tickets resolved in the same period
First Response Time: Average time taken to respond to a ticket (N/A if no responses)
Resolution Time: Average time taken to close tickets
CSAT Score: Average Customer Satisfaction rating (0–5 scale)
Use the Category and Date Range dropdowns to filter data.
Graphs & Trends
1. Total Open vs Closed Tickets
A monthly chart comparing how many tickets were opened and closed over time. Use this to assess if you're resolving issues at the same pace as they’re raised.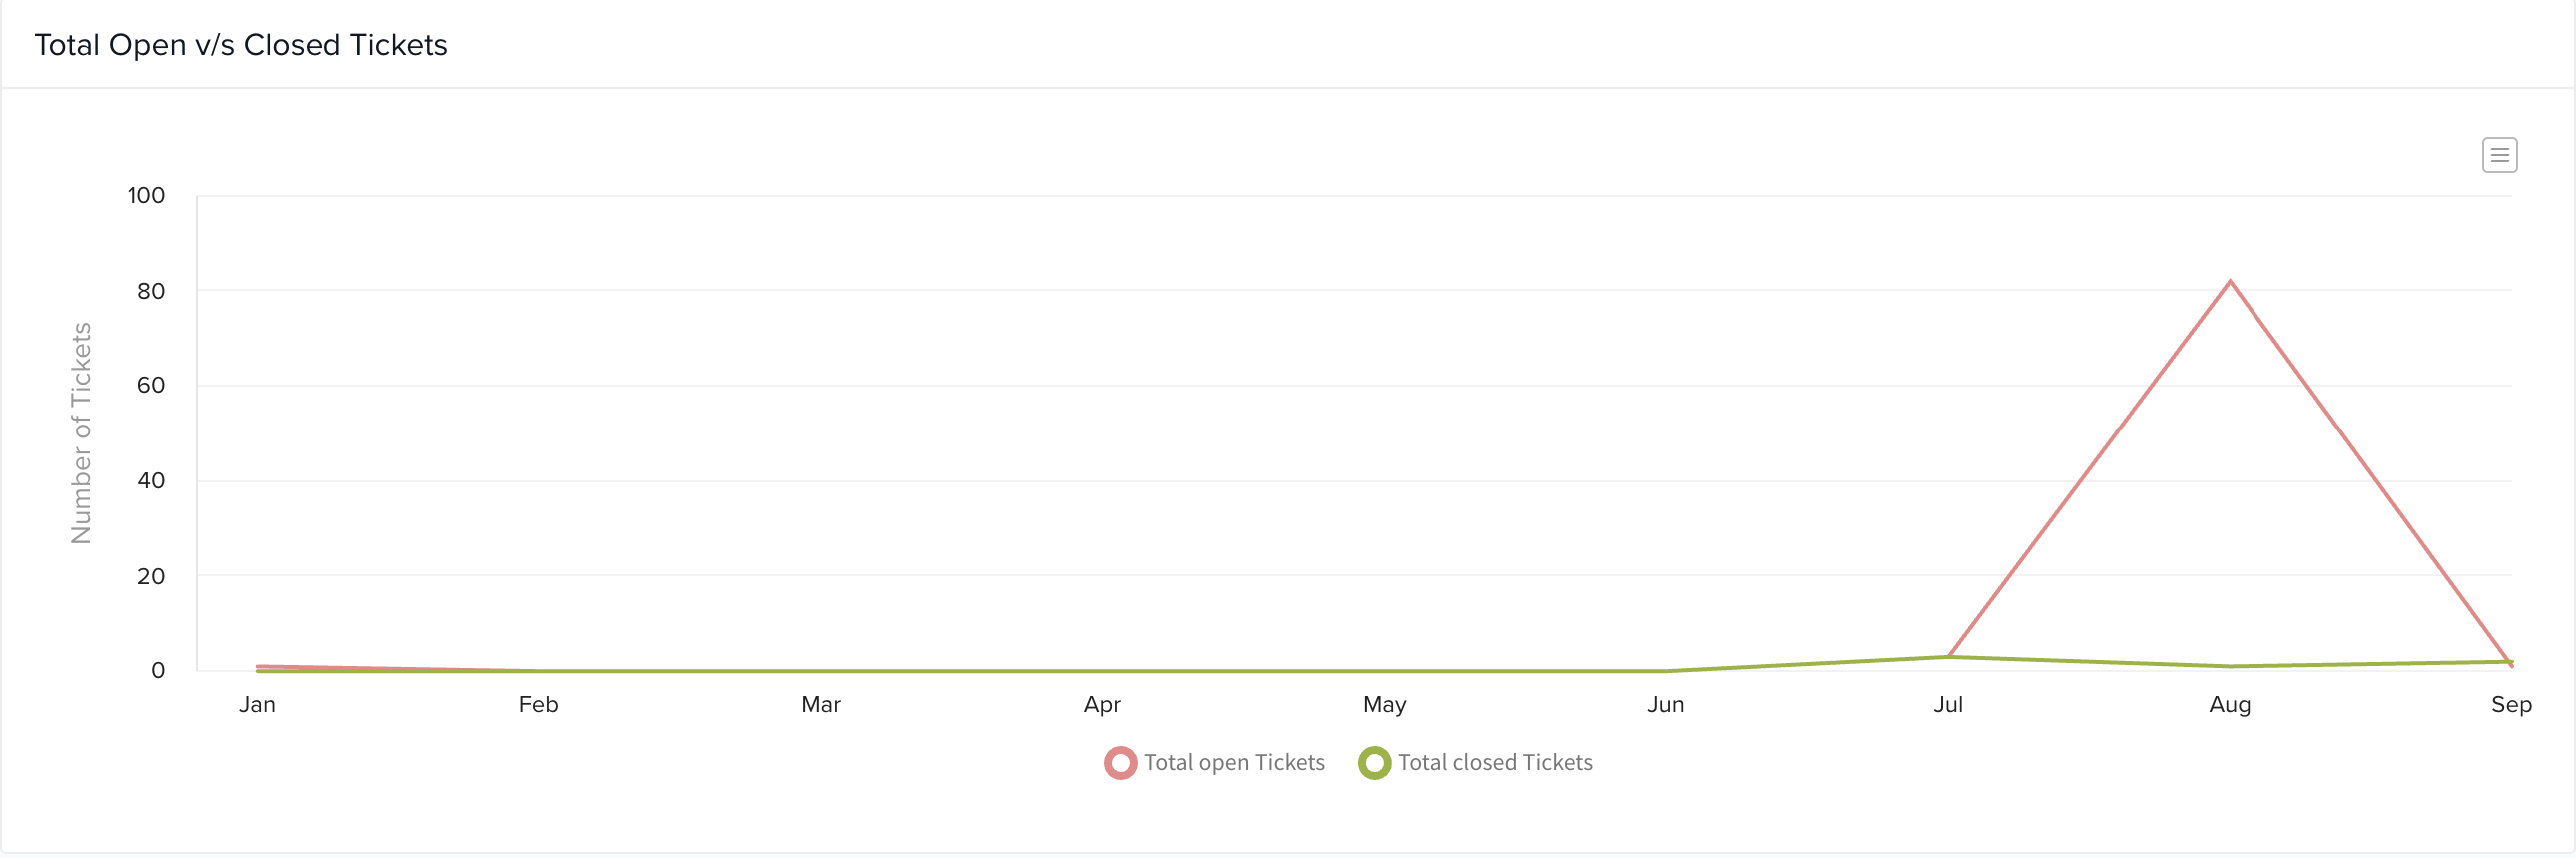
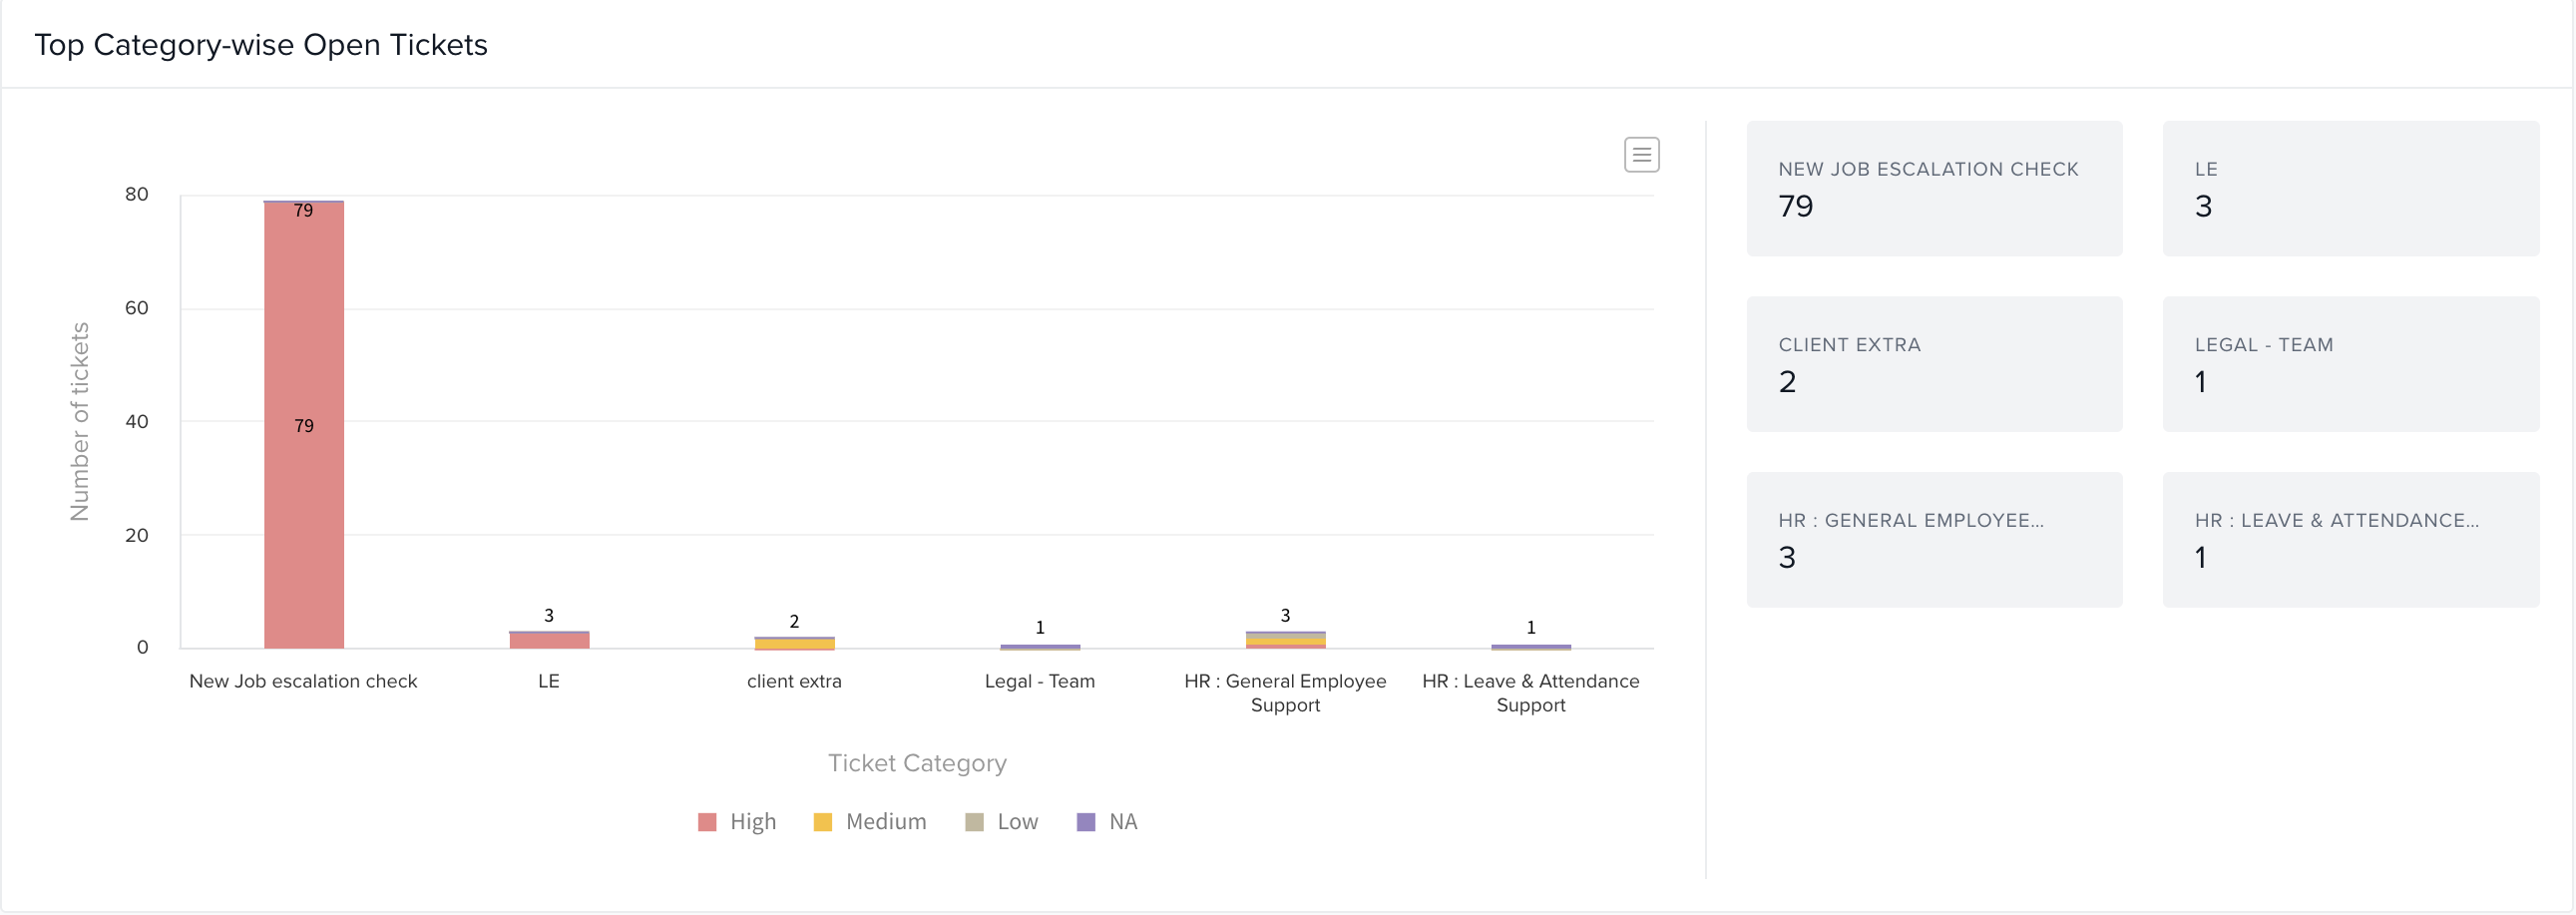
2. Top Category-wise Open Tickets
This bar chart highlights categories with the most open tickets. Each bar is color-coded by priority (High, Medium, Low, NA). Hover over bars to see the count per category.
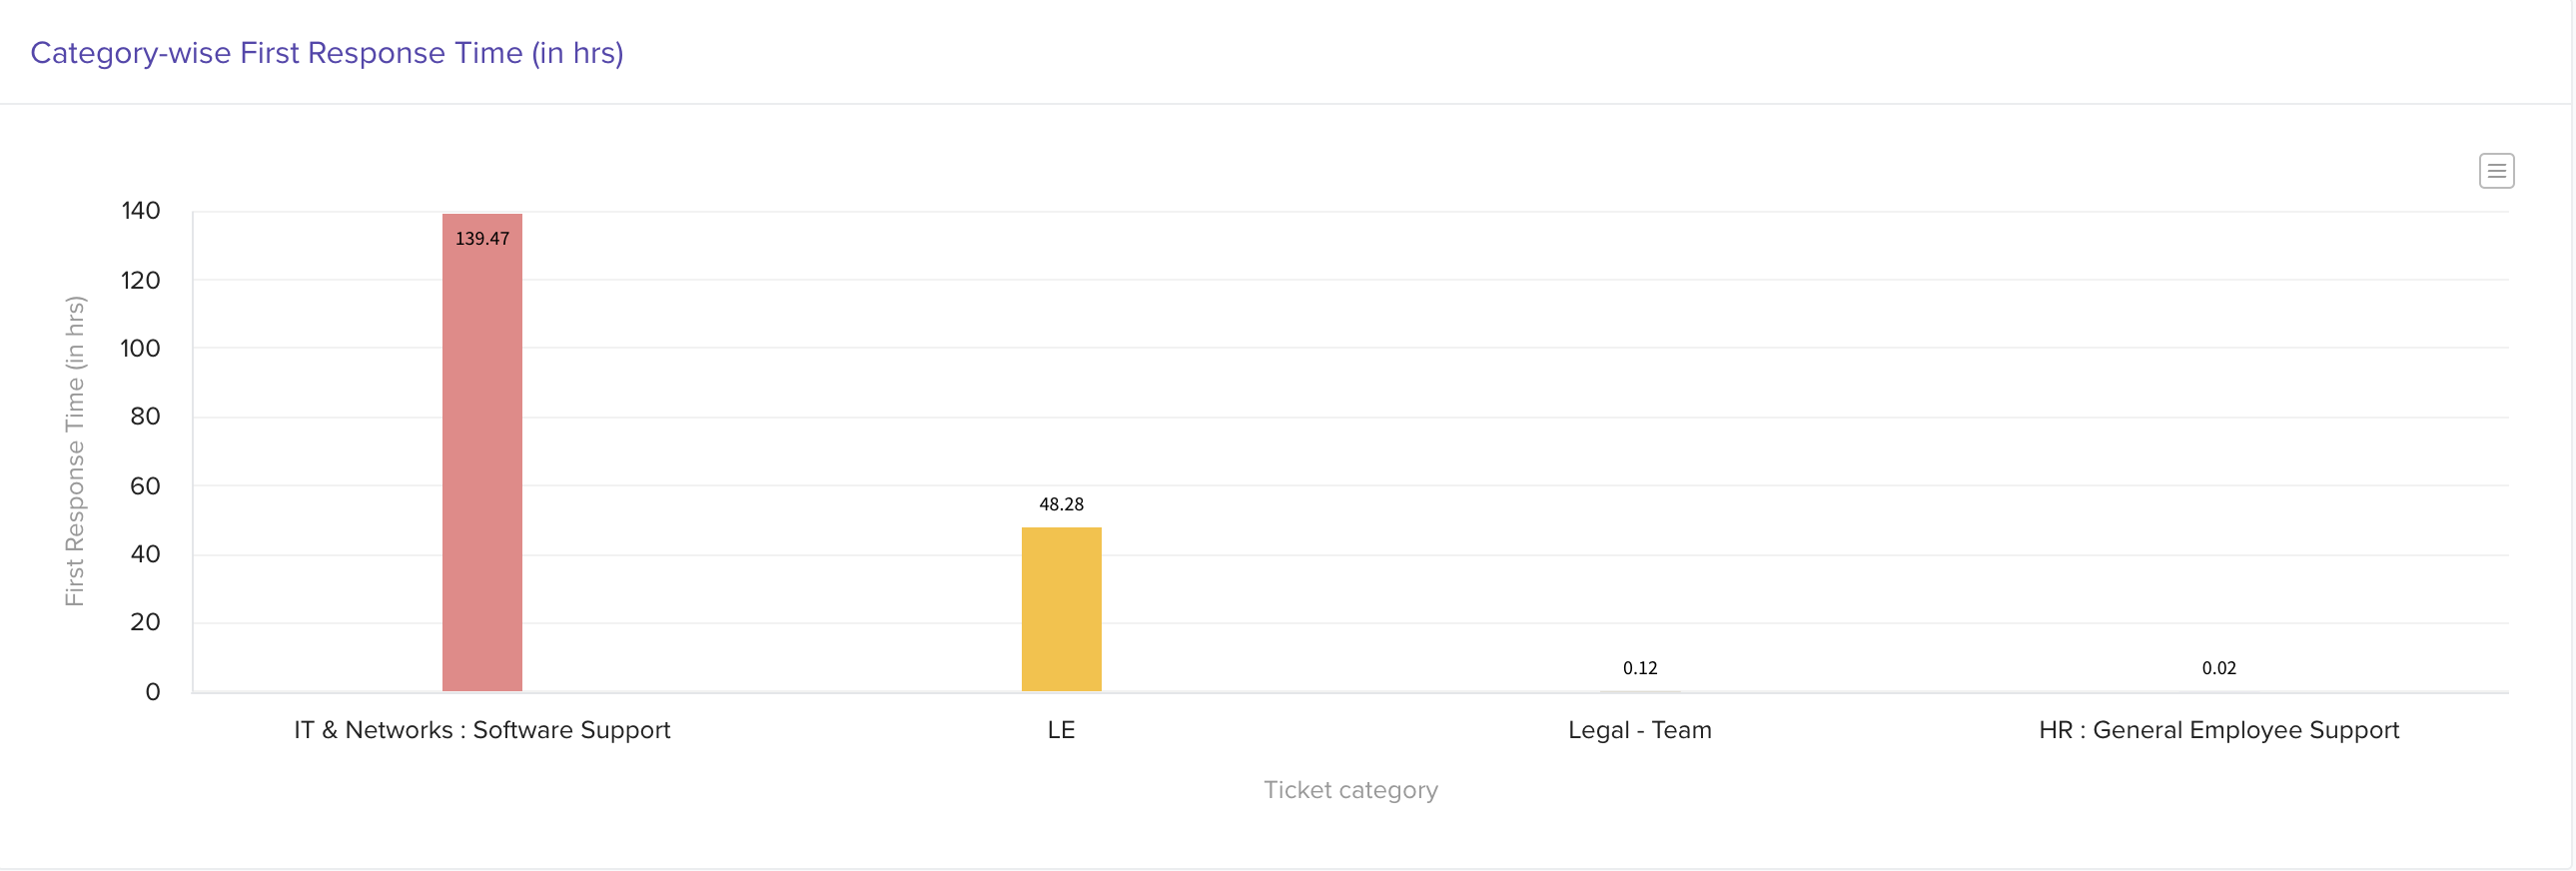
3. First Response Time by Category
Track how quickly teams respond by ticket type. Helps identify delays in high-impact areas.
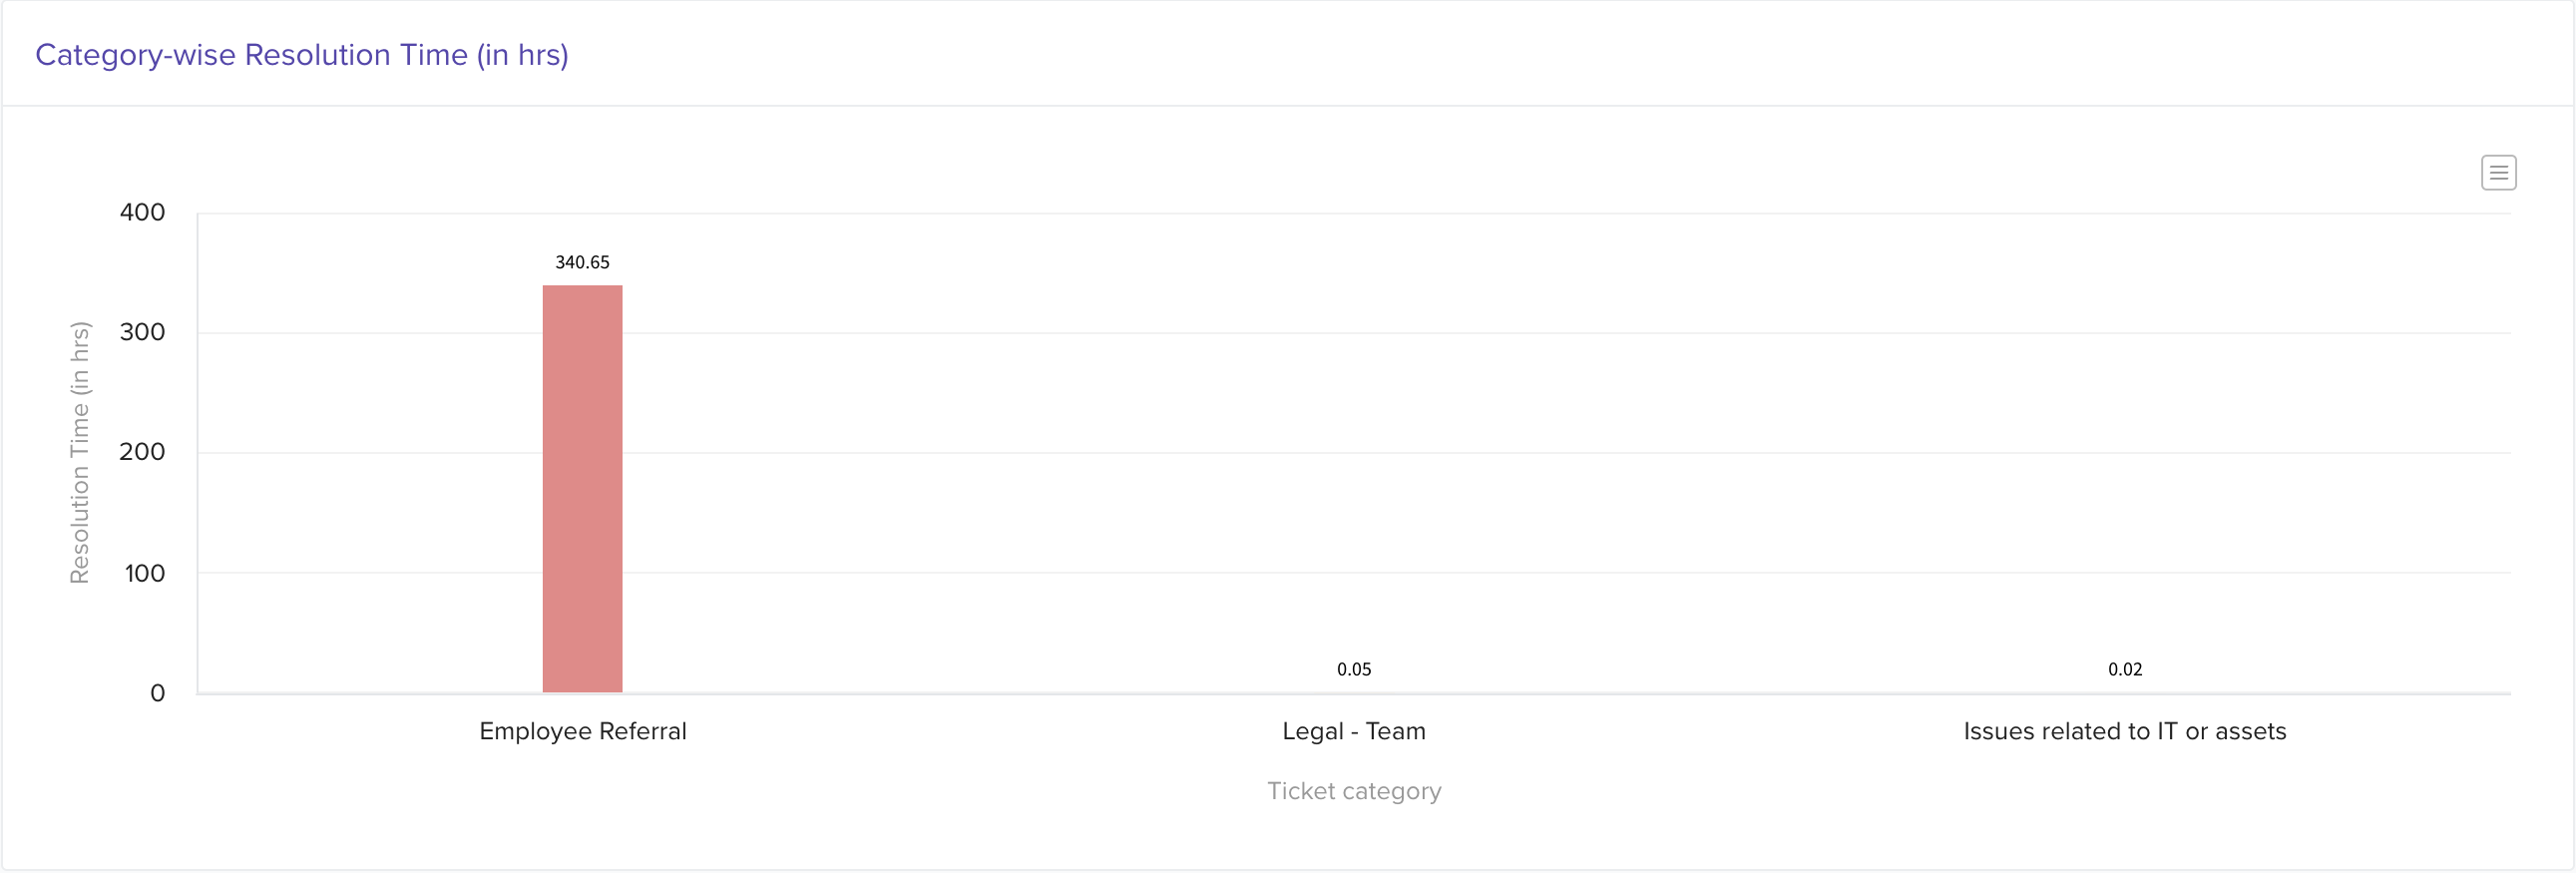
4. Resolution Time by Category
Shows how long it takes to fully resolve issues, categorized by topic. Look for long delays and bottlenecks.
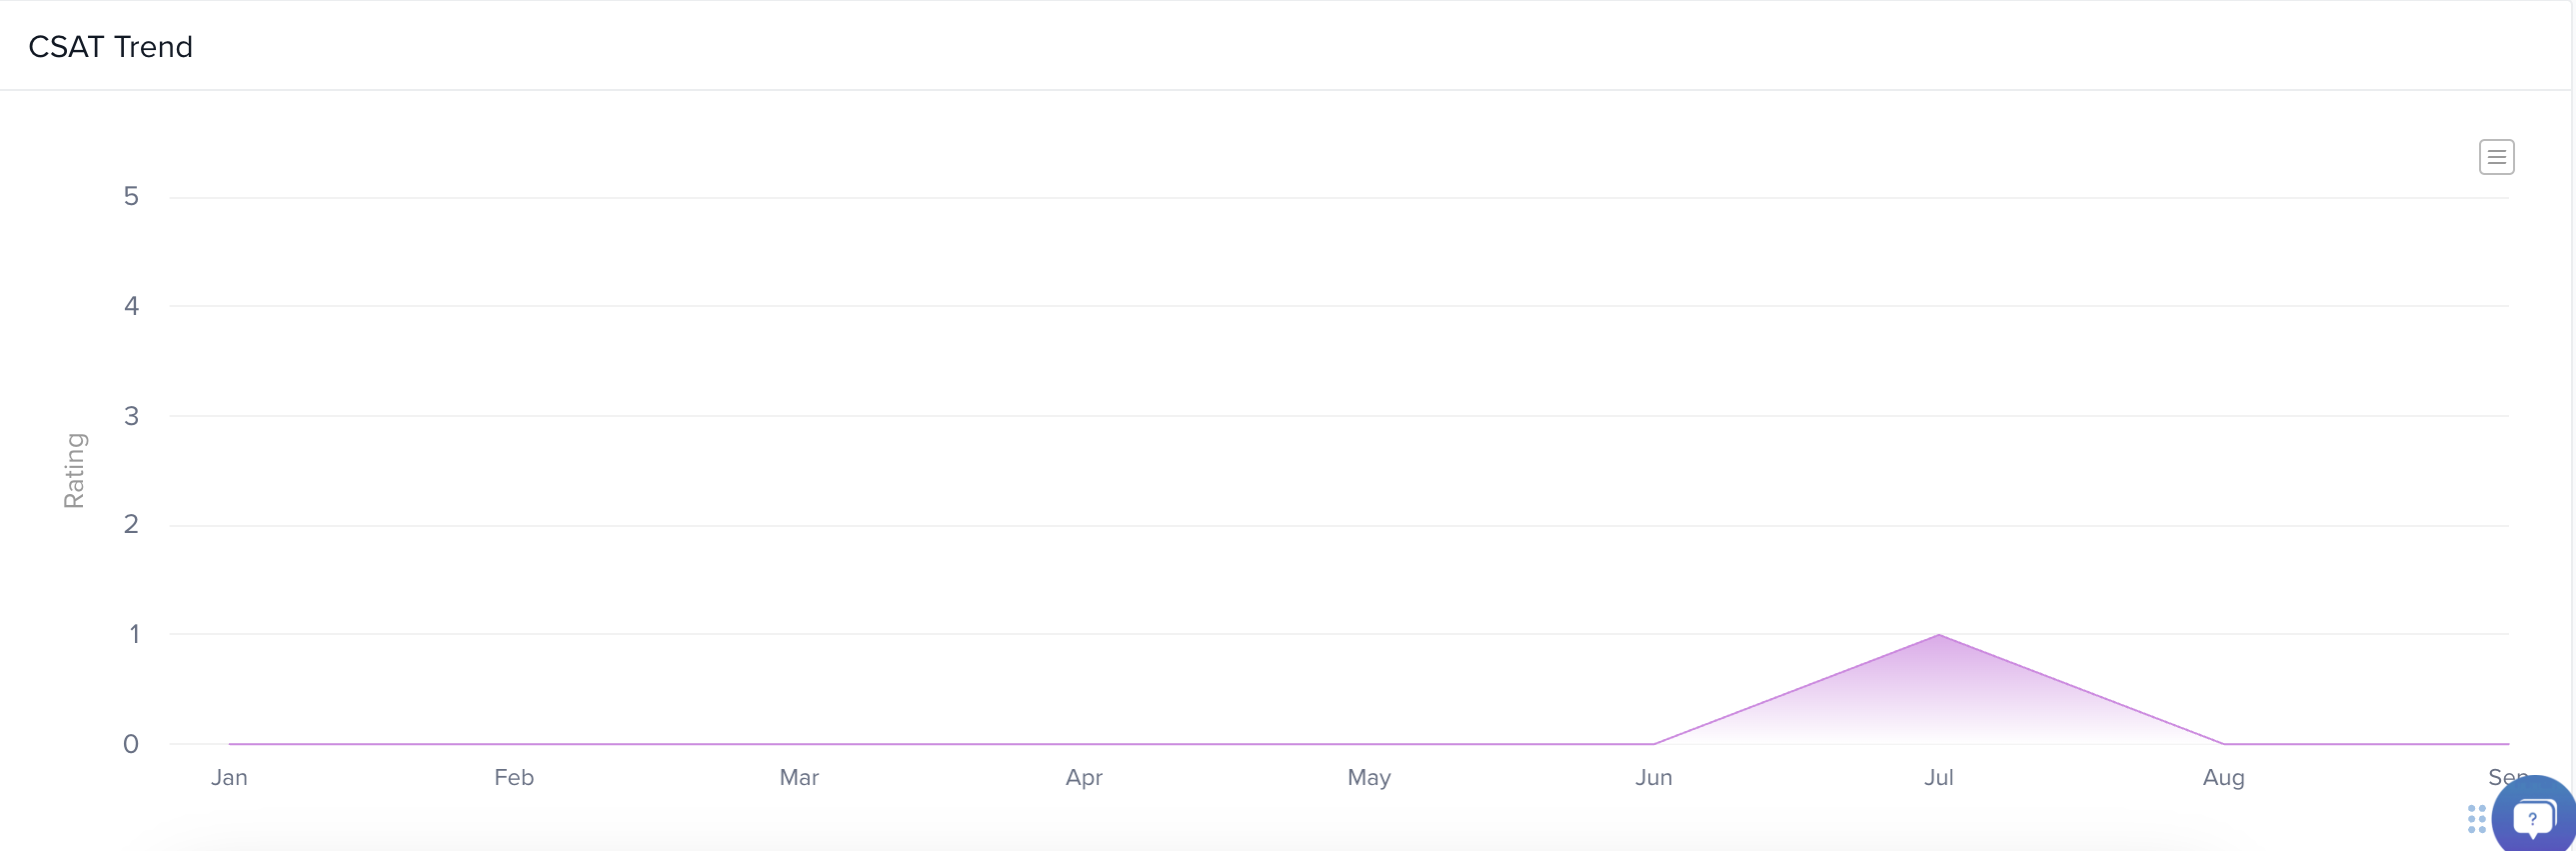
5. CSAT Trend
Line graph showing satisfaction score trends (scale of 1–5) over recent months. Useful for measuring perceived support quality over time.
Comments
0 comments
Please sign in to leave a comment.