Introduction
Keka Learn makes it easy to monitor how learning initiatives are progressing across your organization. You can view learning data at two levels:
Organization-wide analytics for all courses
Individual course analytics
This guide walks you through both views to help you stay on top of learner progress.
Viewing Overall Learning Analytics
To see a summary of learning performance across all courses:
Go to the Keka Learn module from the left navigation menu.
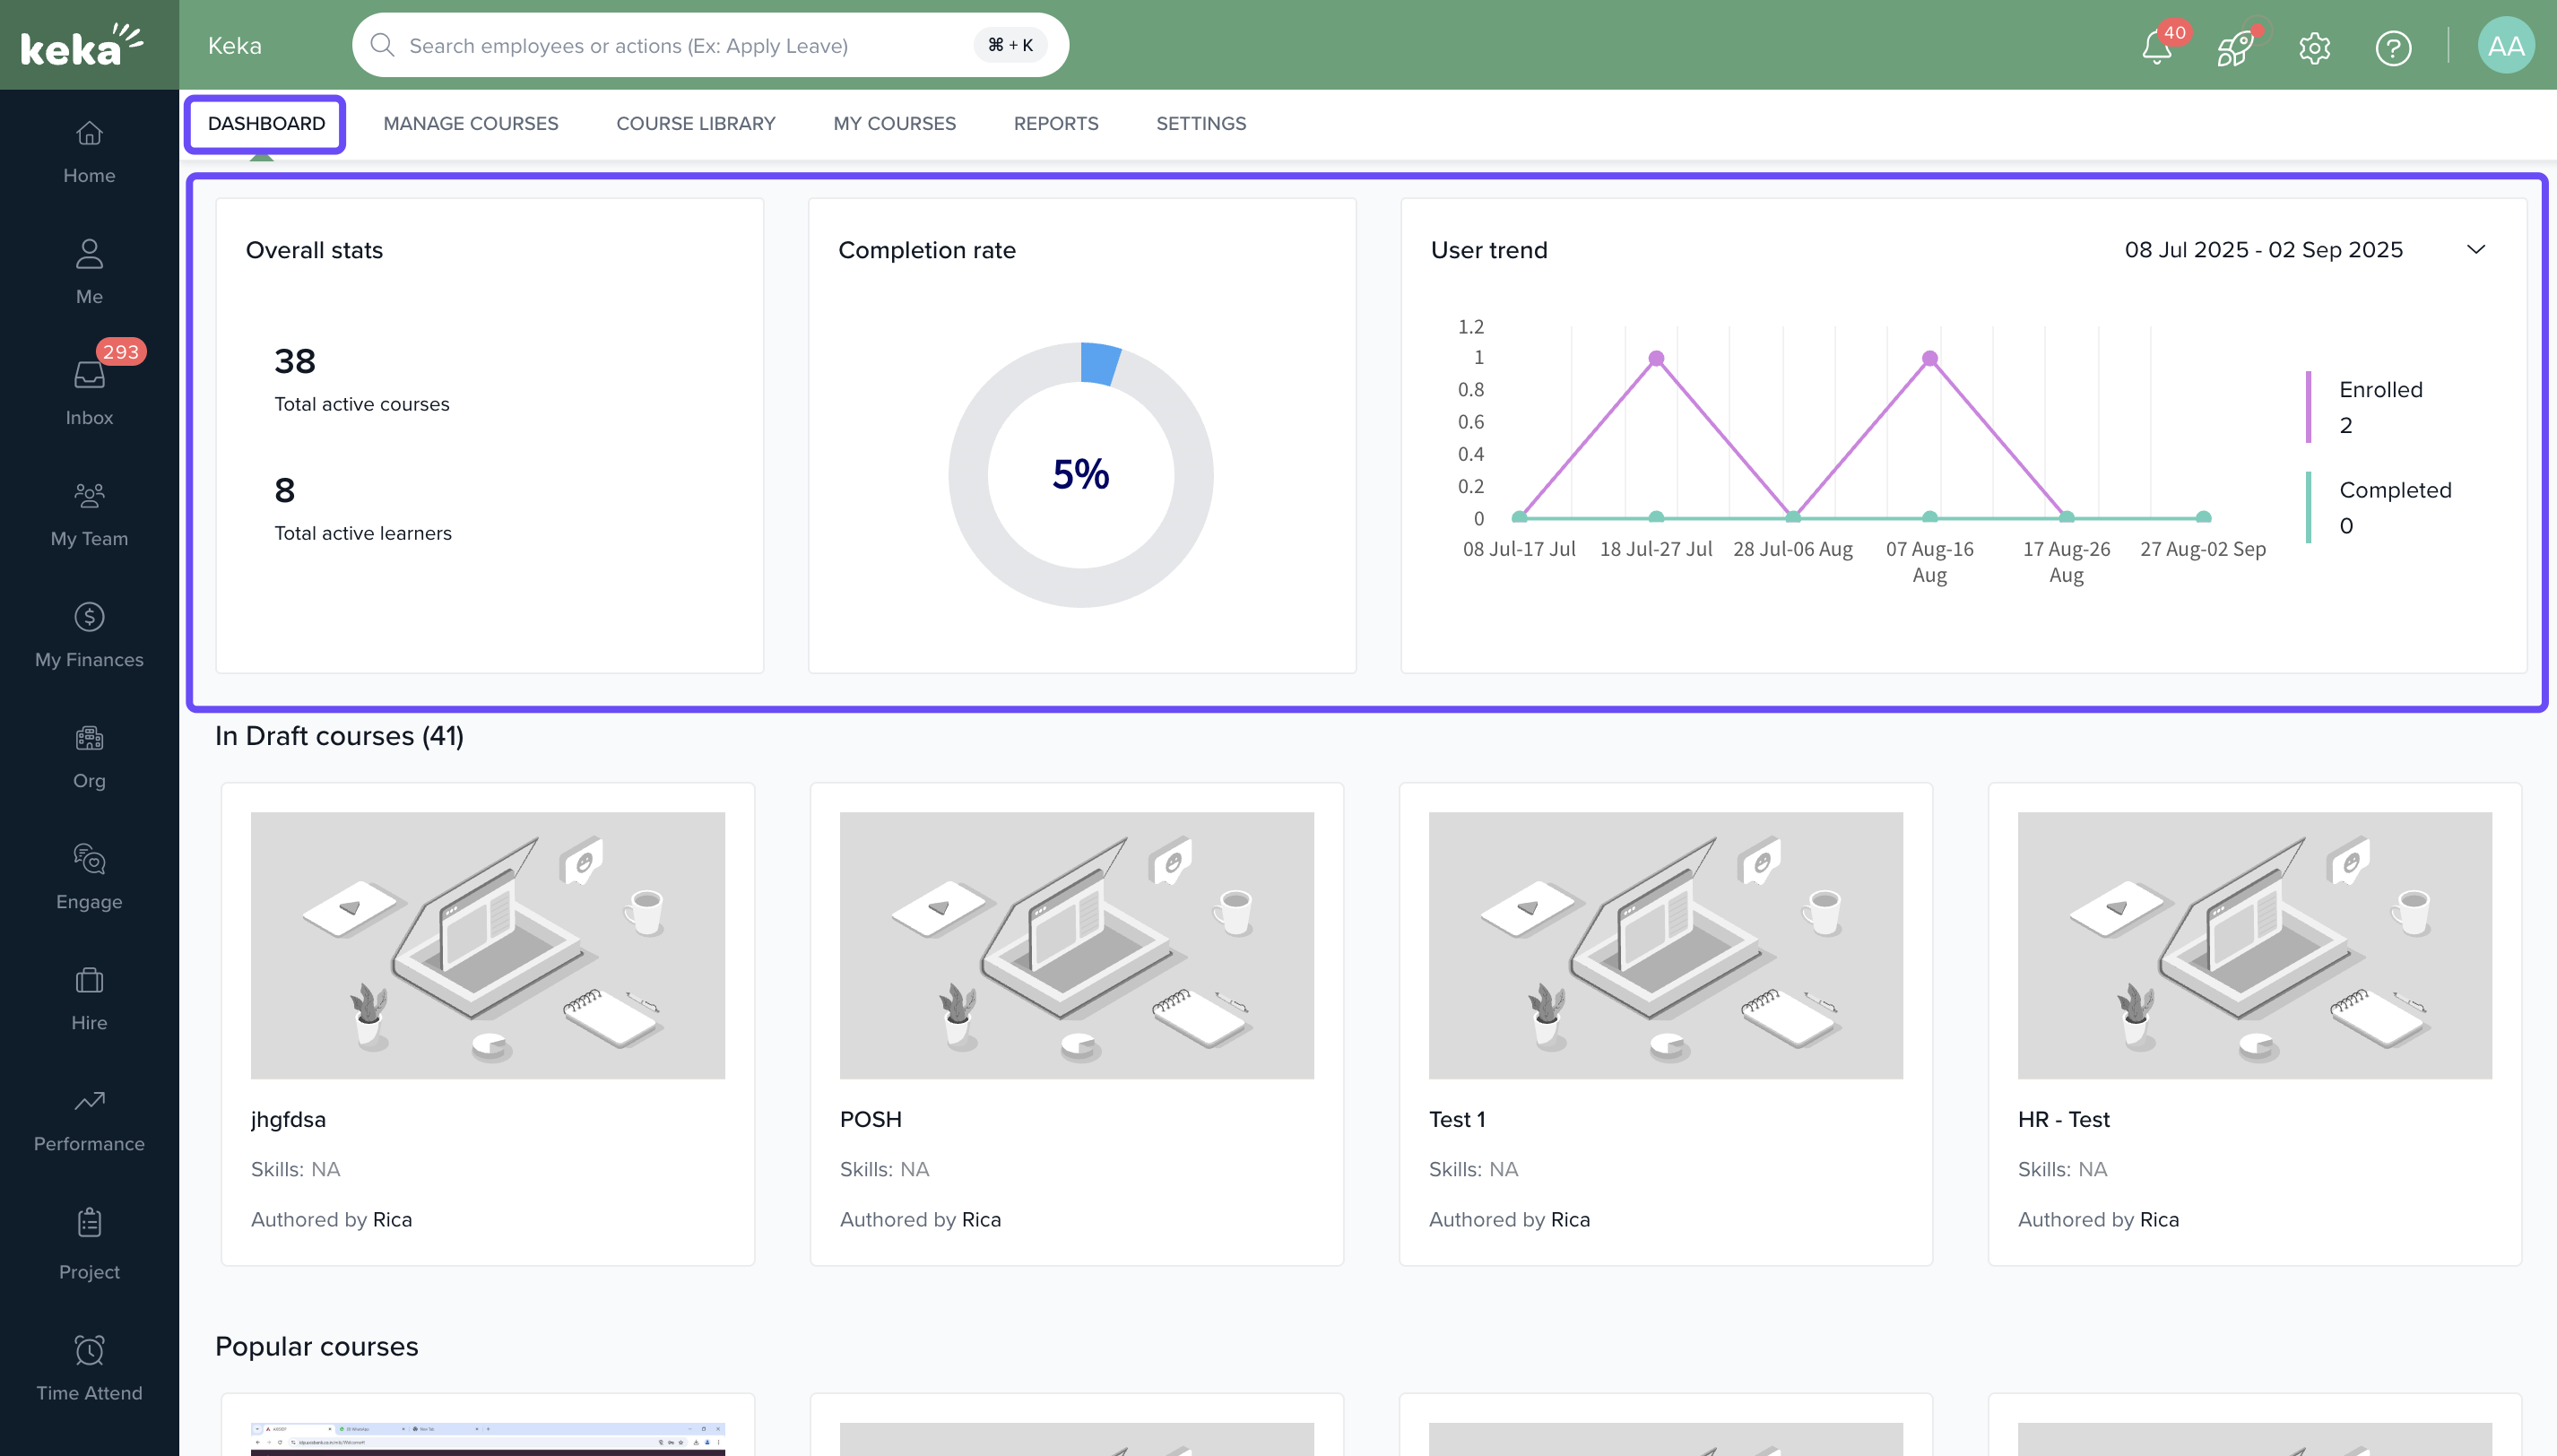
You’ll land on the Dashboard page.
-
At the top of this page, you'll find high-level statistics for your published courses:
Number of Active Courses: Total courses currently available to learners.
Total Active Learners: Number of users enrolled in any active course.
Completion Rate: Percentage of enrolled learners who completed their course within the set time.
Yearly User Trend: Visual chart showing course enrollment and completion trends over the past year.
Viewing Analytics for a Specific Course
To dive into data for a particular course:
From the Dashboard or the Manage Courses tab, select the course you want to analyze.
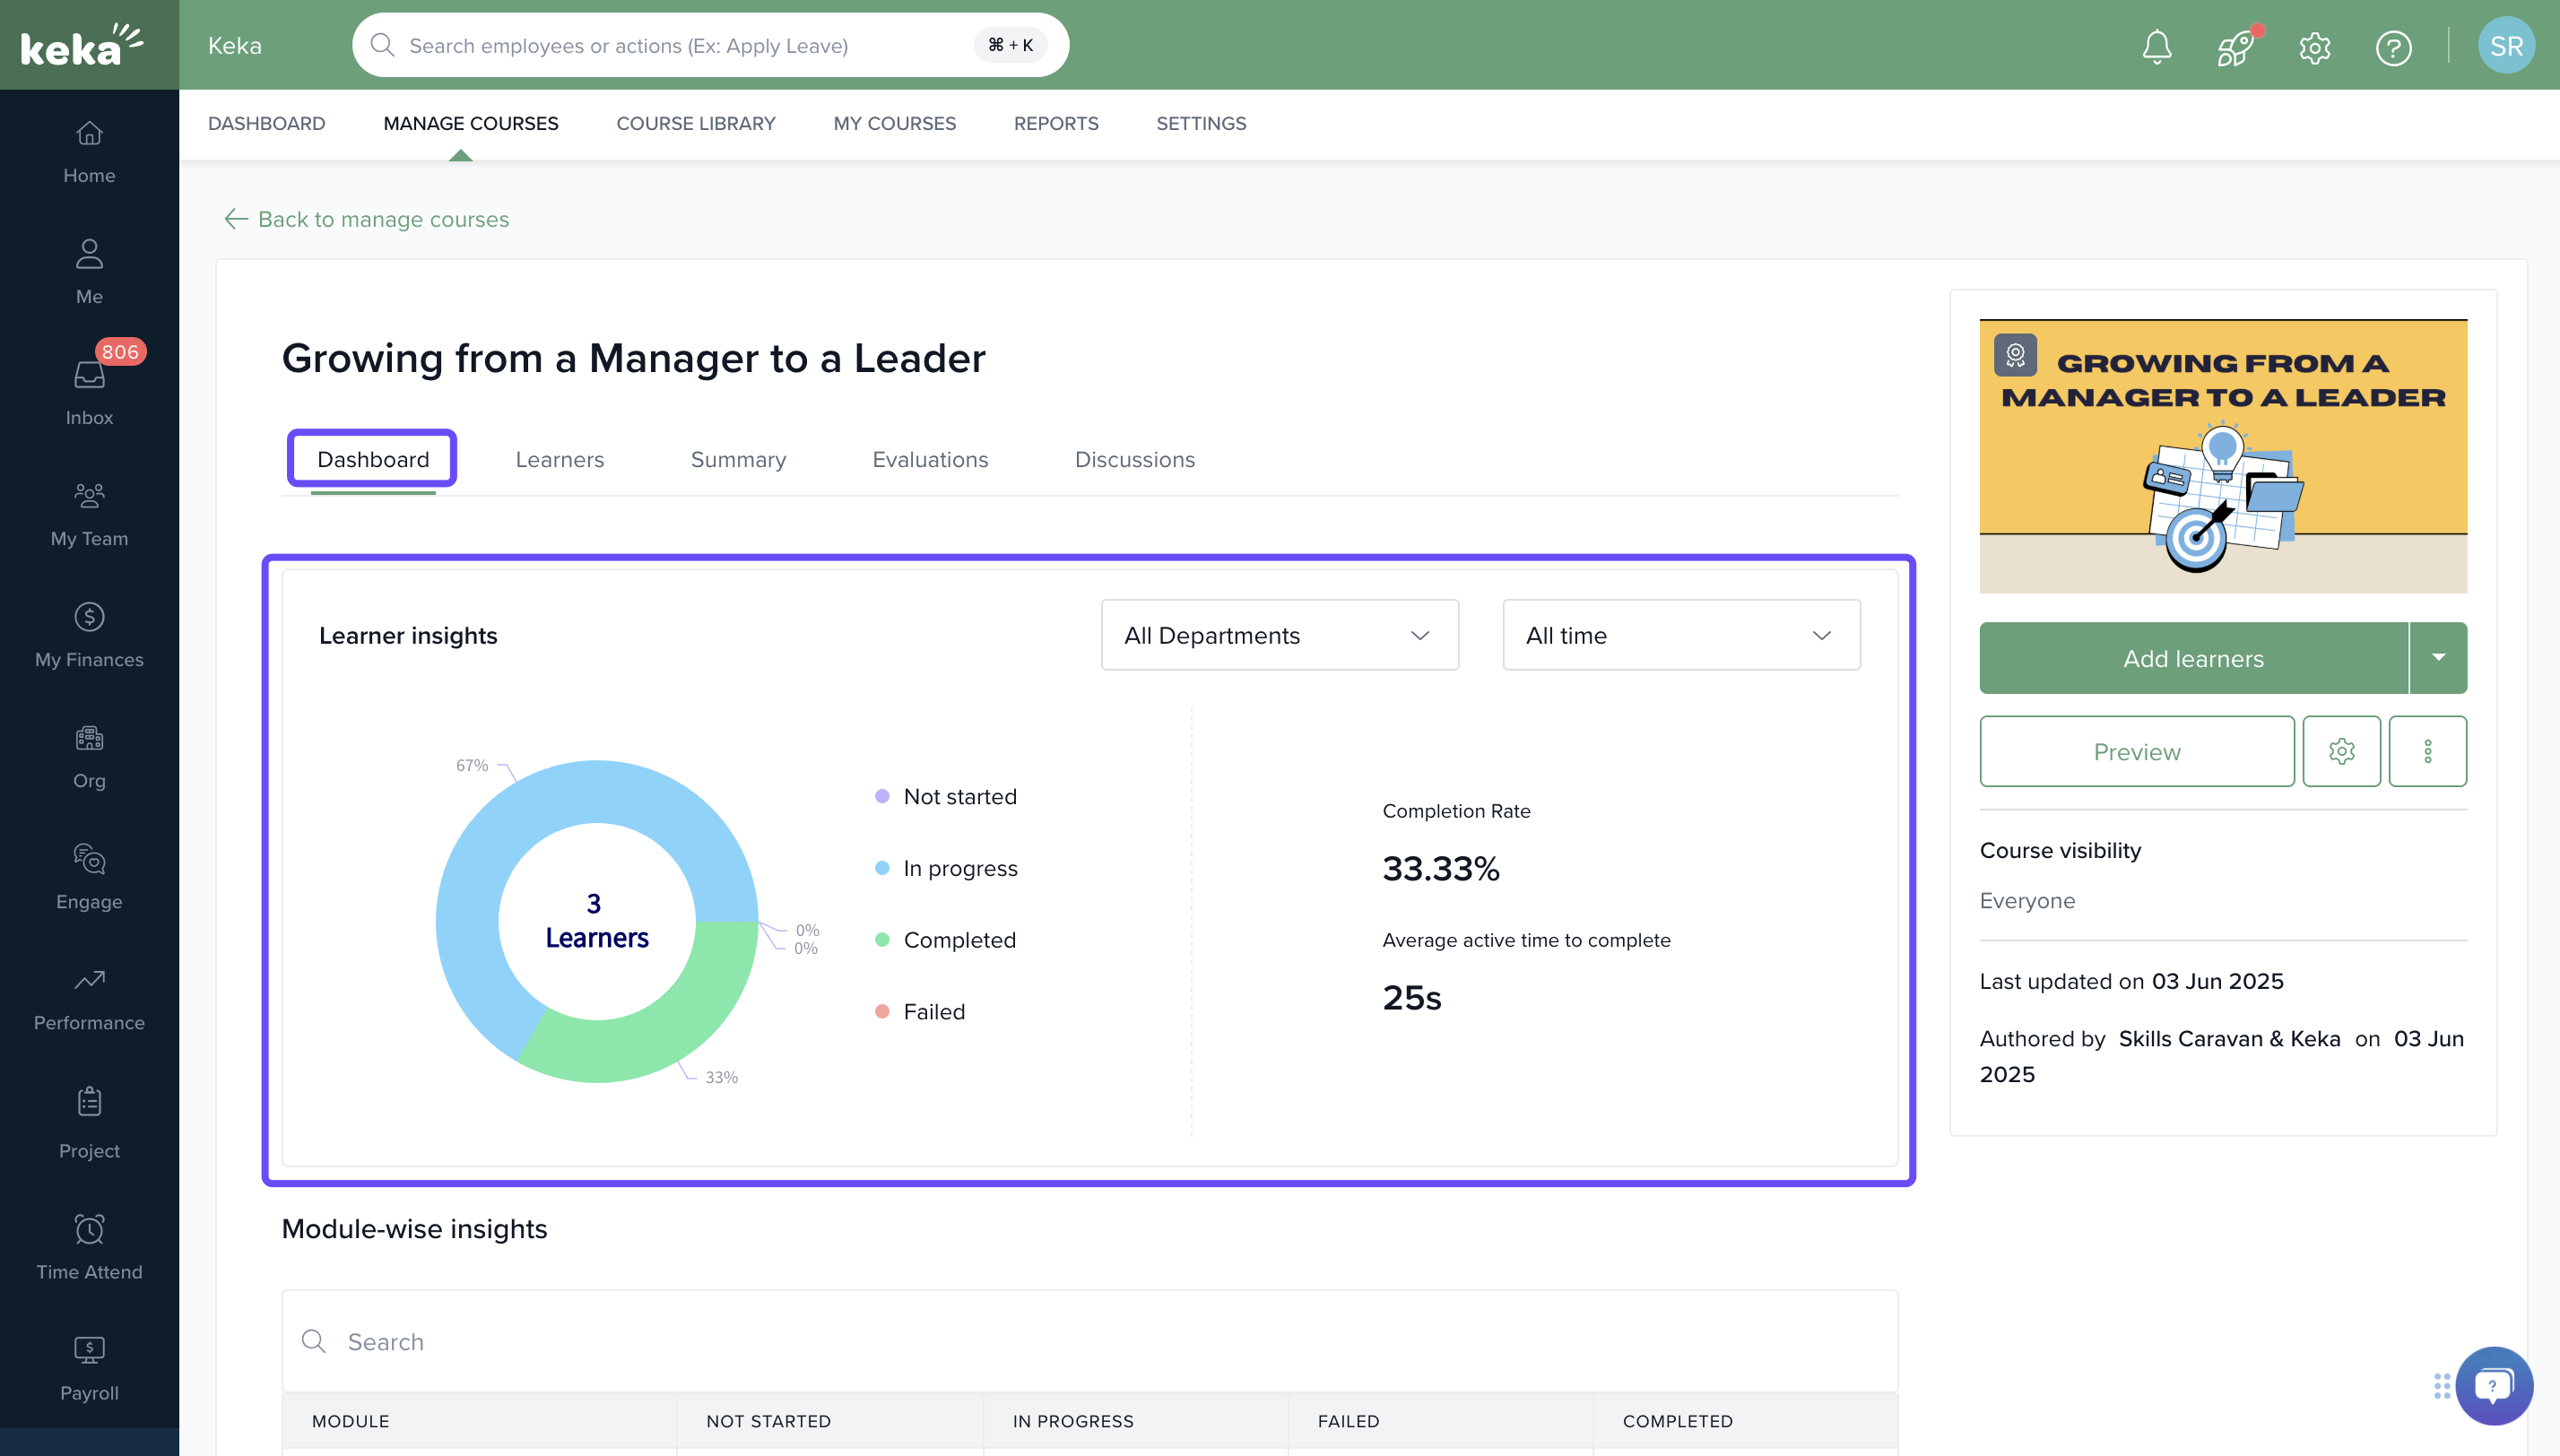
The course analytics page will open with detailed insights. Here’s what you’ll see:
-
-
Learner Insights: Breakdown of learner progress, including:
-
Completed
In progress
Failed
-
Completion Rate & Time Taken: View the course’s overall completion rate and the average time learners take to finish it.
-
Note: Completion Rate reflects only those who completed the course within the allotted duration—not late completions.
You can also filter this data by custom time ranges to view trends over specific periods.
Options & Variants
Dashboard vs. Course view: Use the Dashboard for an overview across all courses. Use the Manage Courses tab to drill down into specific course analytics.
Time filters: Apply custom time ranges to see historical trends or recent performance.
Field Reference
| Metric | Description |
|---|---|
| Active Courses | Number of courses currently available to learners |
| Total Active Learners | Total learners enrolled in at least one active course |
| Completion Rate | % of learners who completed the course within the allowed time |
| Learner Insights | Status breakdown: completed, in-progress, failed |
| Time Taken to Complete | Average duration learners take to complete the course |
| Yearly User Trend | Graph showing changes in course enrollments and completions over the year |
Keka Learn analytics give you clear insights at both the organization and course level. With easy-to-use filters and key metrics, you can track progress, spot trends, and improve learning outcomes effectively.
To know about reports in Keka Learn, Click Here.
Comments
0 comments
Please sign in to leave a comment.